Blockware Intelligence Newsletter: Week 68
Blockware Intelligence Newsletter: Week 68Bitcoin on-chain analysis, mining analysis, macro analysis; overview of 12/17/22-12/23/22
Blockware Intelligence Sponsors If you are interested in sponsoring Blockware Intelligence email: sponsor@blockwaresolutions.com.
Blockware Intelligence Twitter Spaces Discussion On Wednesday, our team was joined by Blockware Chief Revenue Officer Danny Condon for a live Twitter Spaces in which we discussed everything related to Macro, Bitcoin, and Bitcoin Mining. This 50 minute conversation will be a great listen while you are traveling for the holidays or even if you are just relaxing at home. Check it out! Summary
General Market Update From a structural 10,000-foot view, not much has changed in the markets from last week. For investors of the traditional financial markets, the narrative remains constant. The “General Market Update” section from last week’s Blockware Intelligence newsletter provided a holistic view of the markets, the Fed, and inflation in the last few weeks of 2022. In case you missed it, we highly recommend going back and checking it out. Furthermore, if you’re interested in learning more about the Blockware Intelligence team’s outlook on all things macro, Bitcoin, and mining for the new year, be sure to check out our 2023 Market Forecast. As a reminder of last week’s discussion, there are two MAIN narratives that are driving the decision making of investors at the moment. Of course, there are several variations of these theses, but at the highest level, the two major forward-looking macroeconomic narrative are as follows:
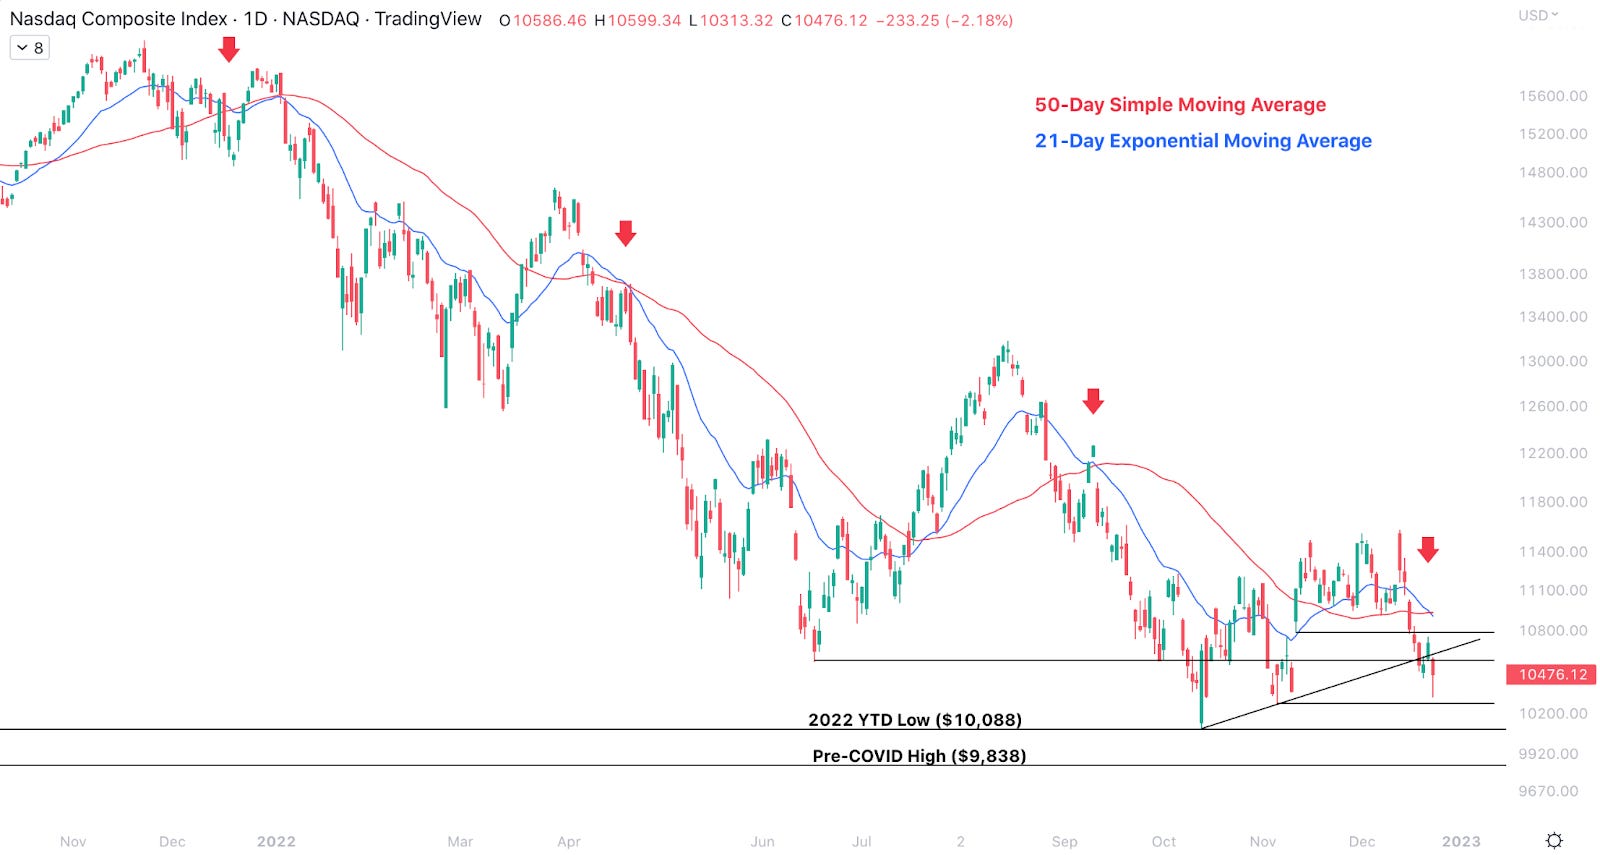
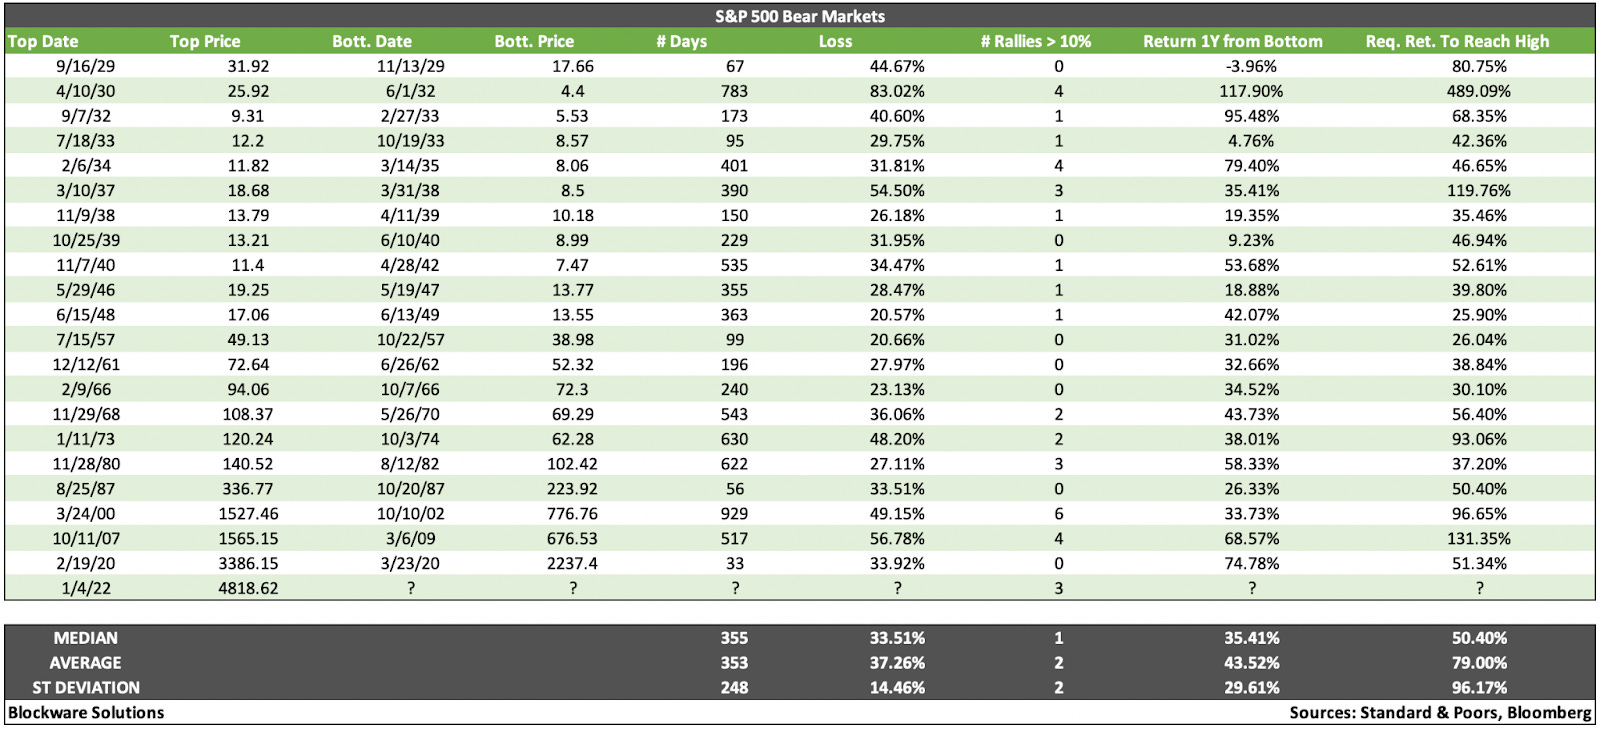
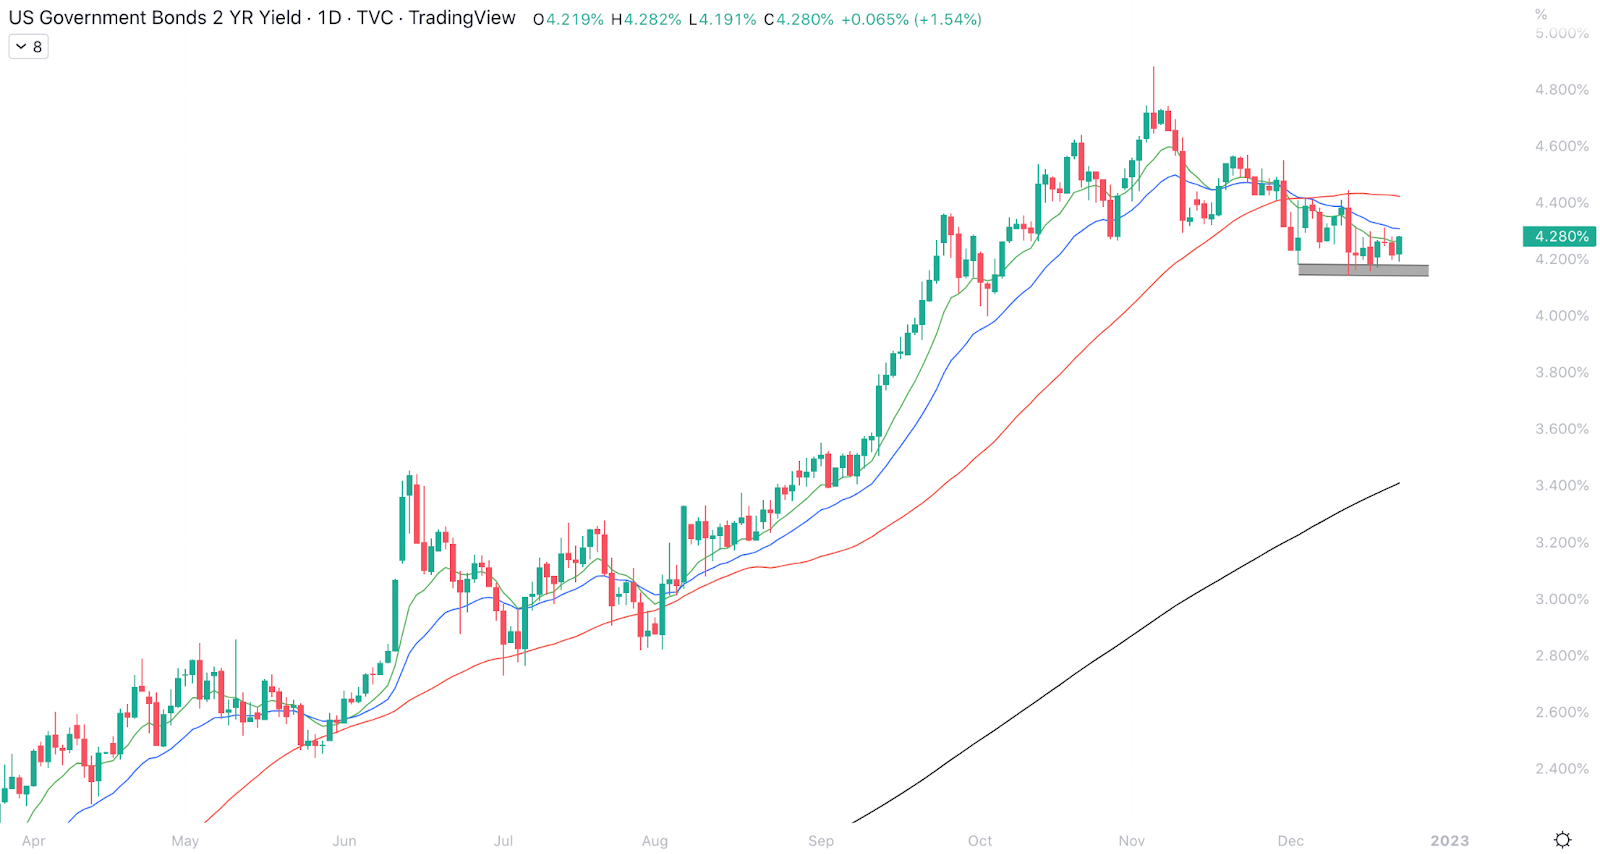
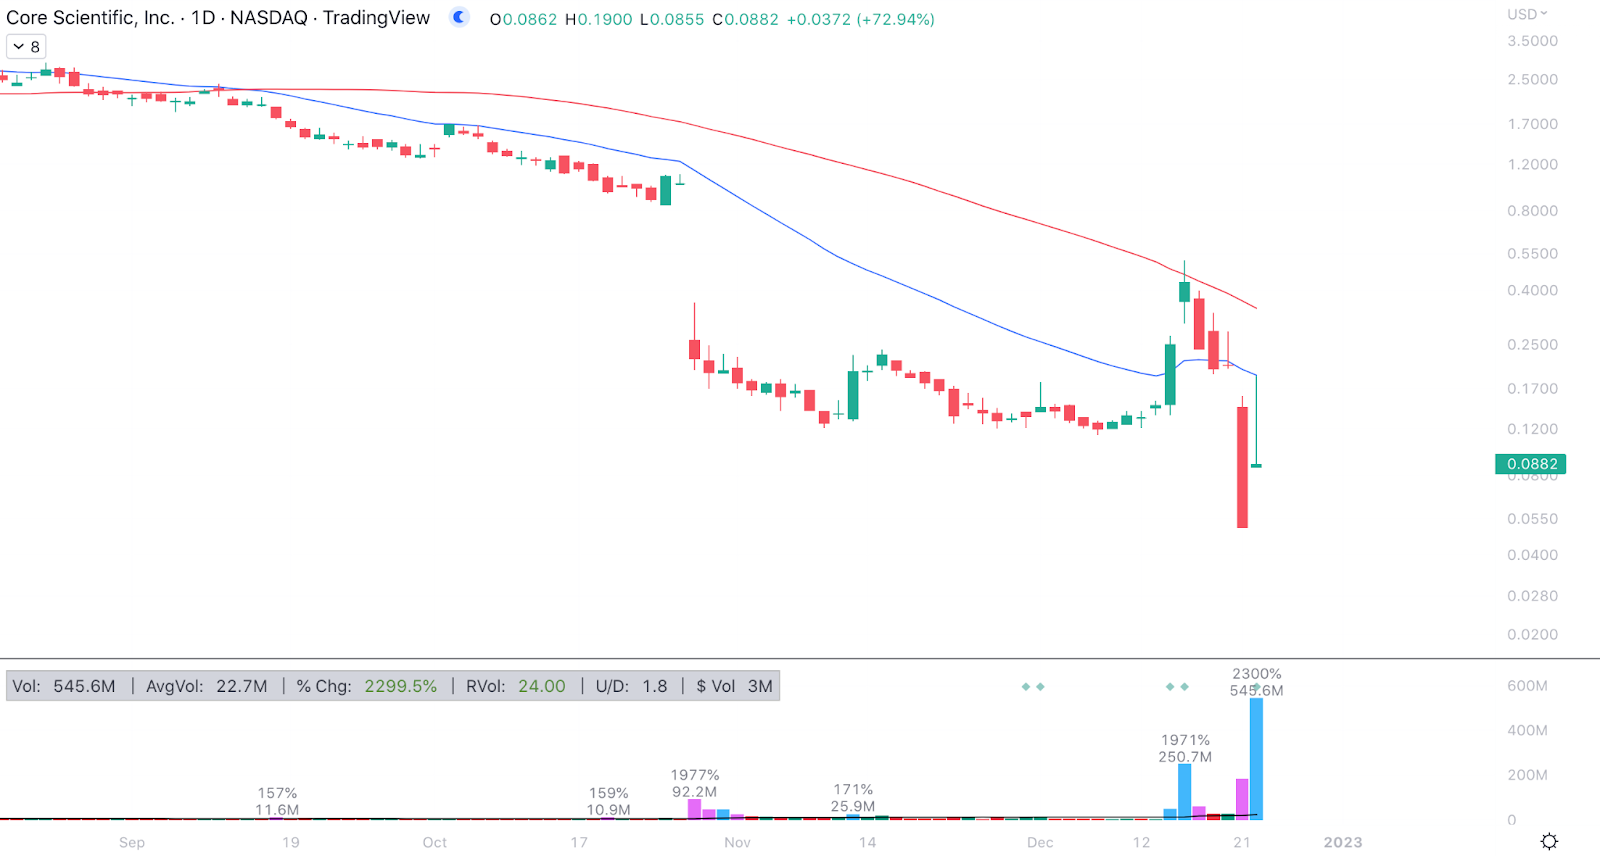
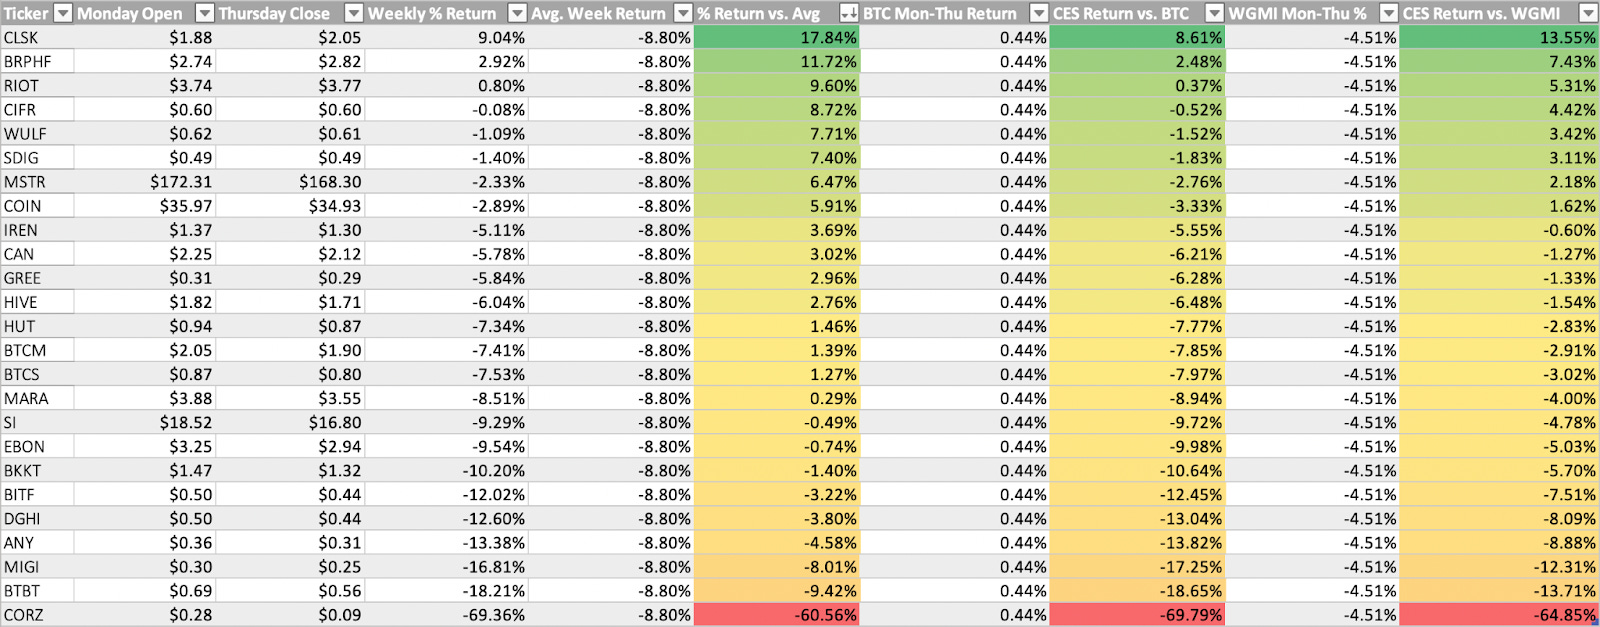
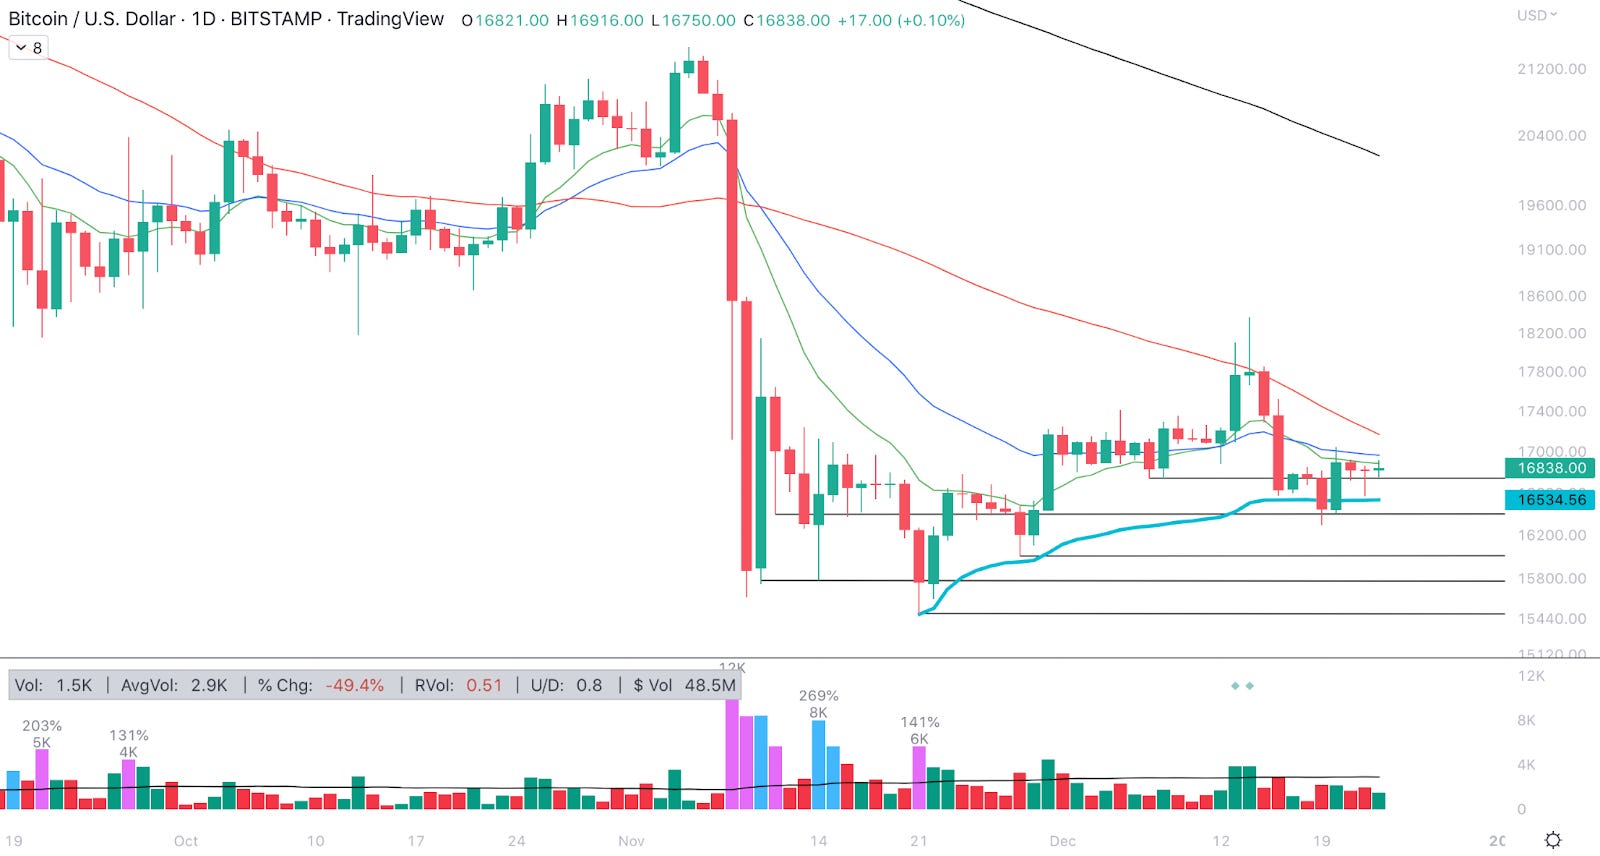
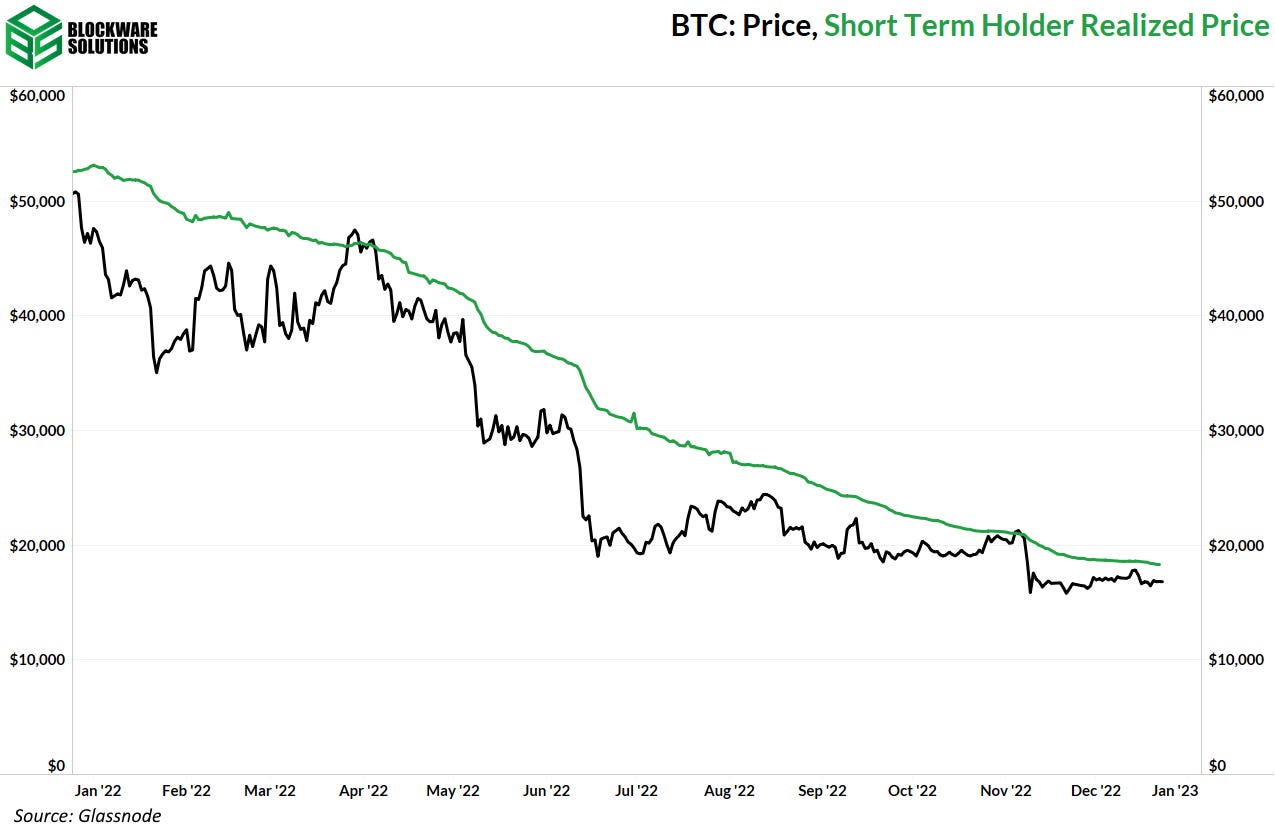
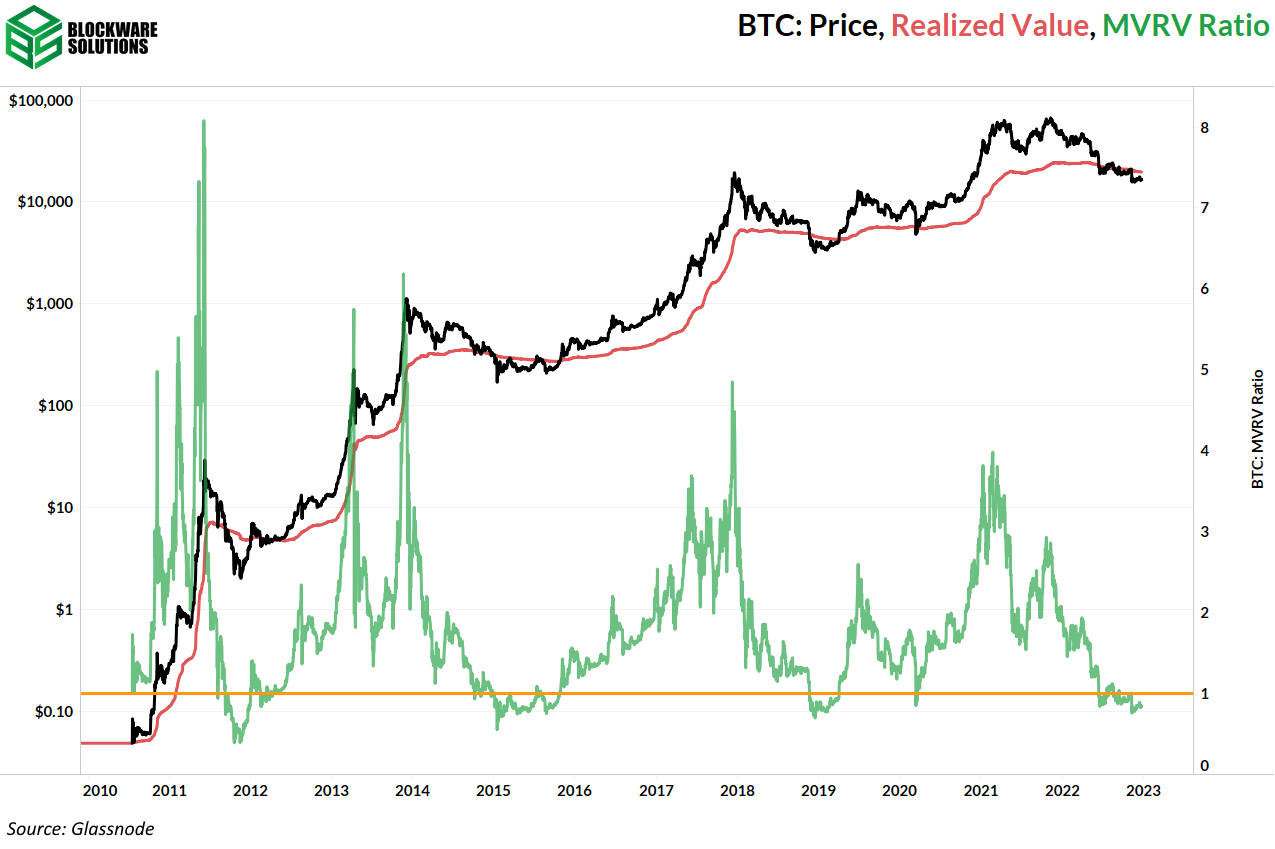
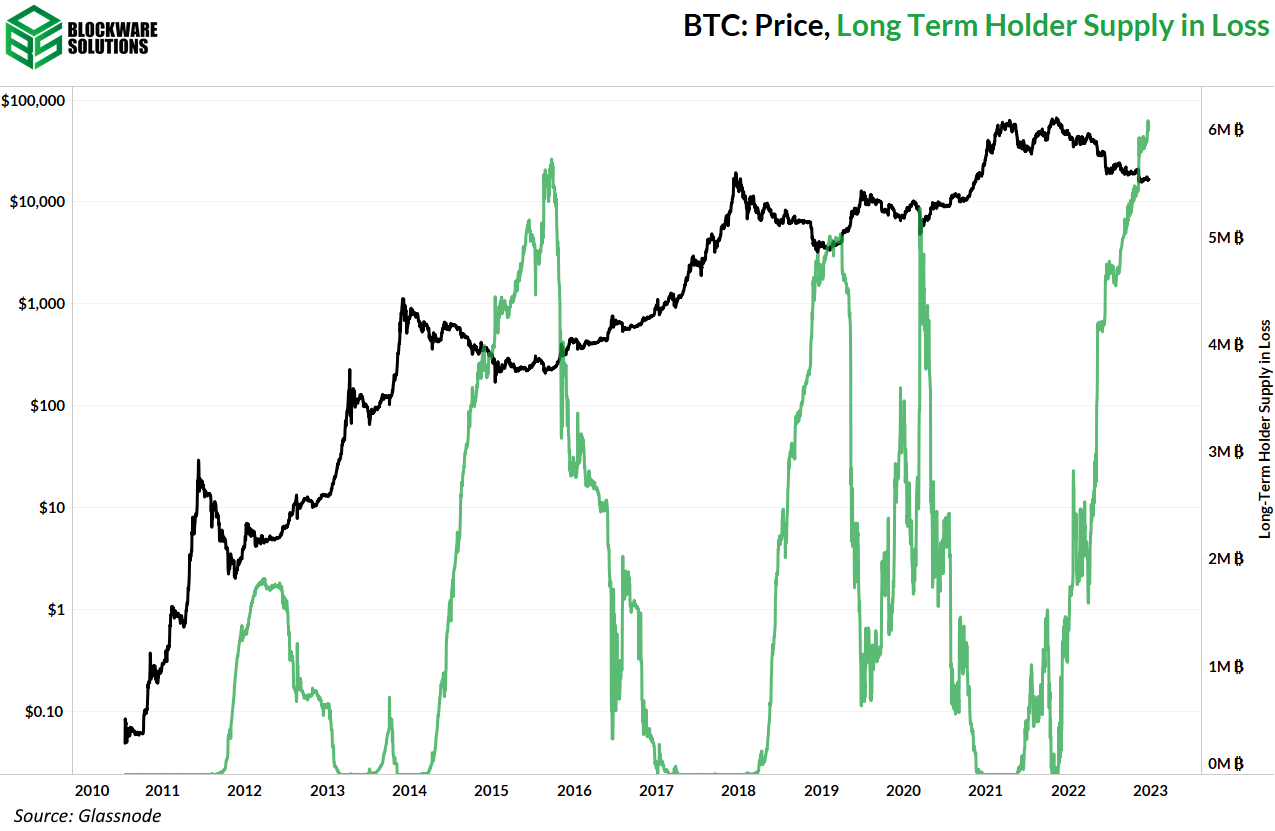
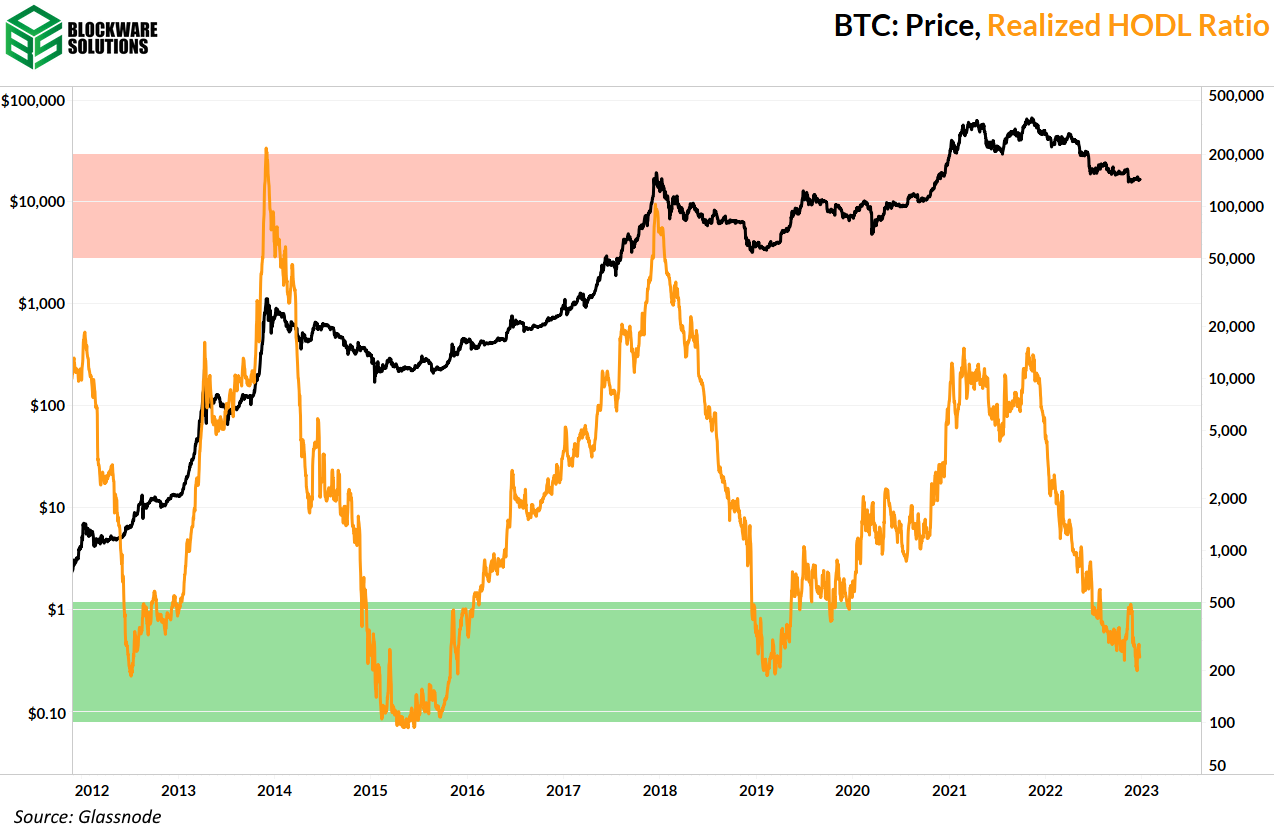
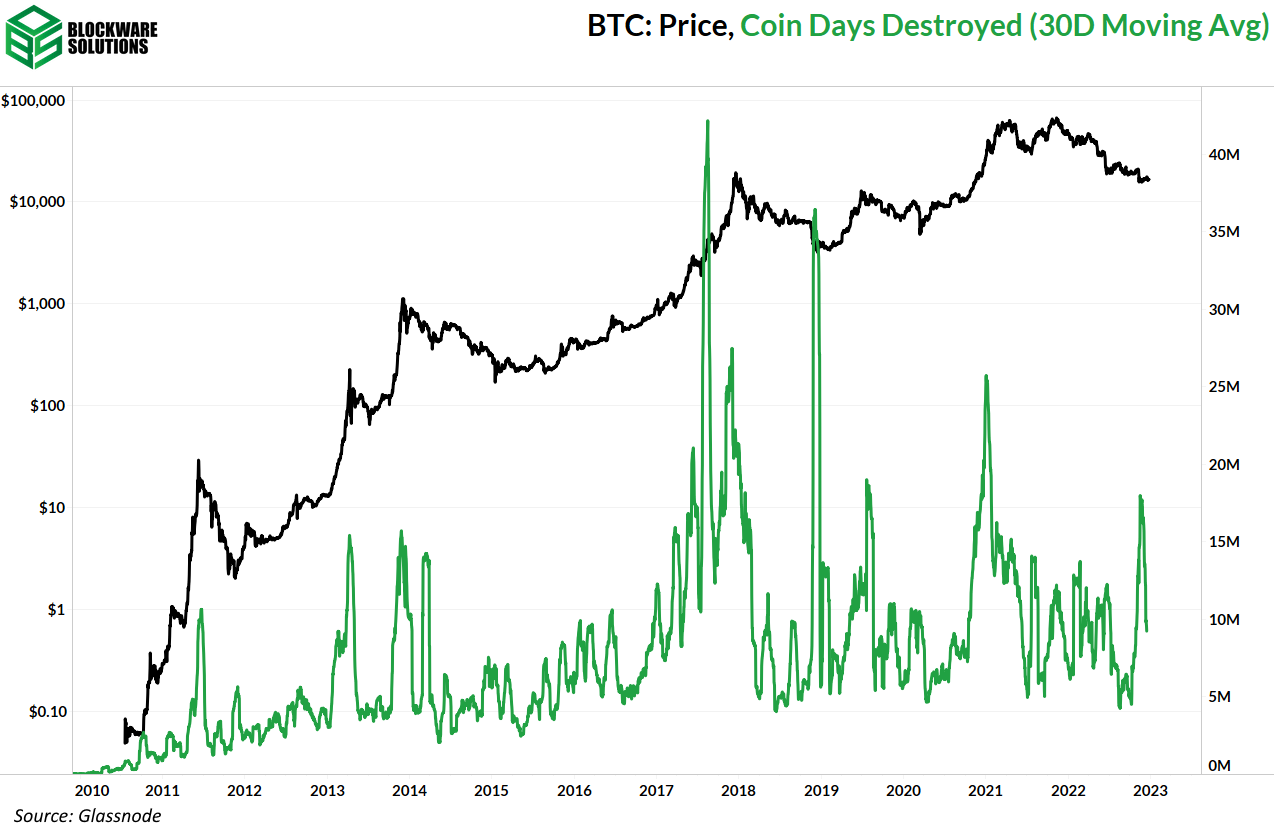
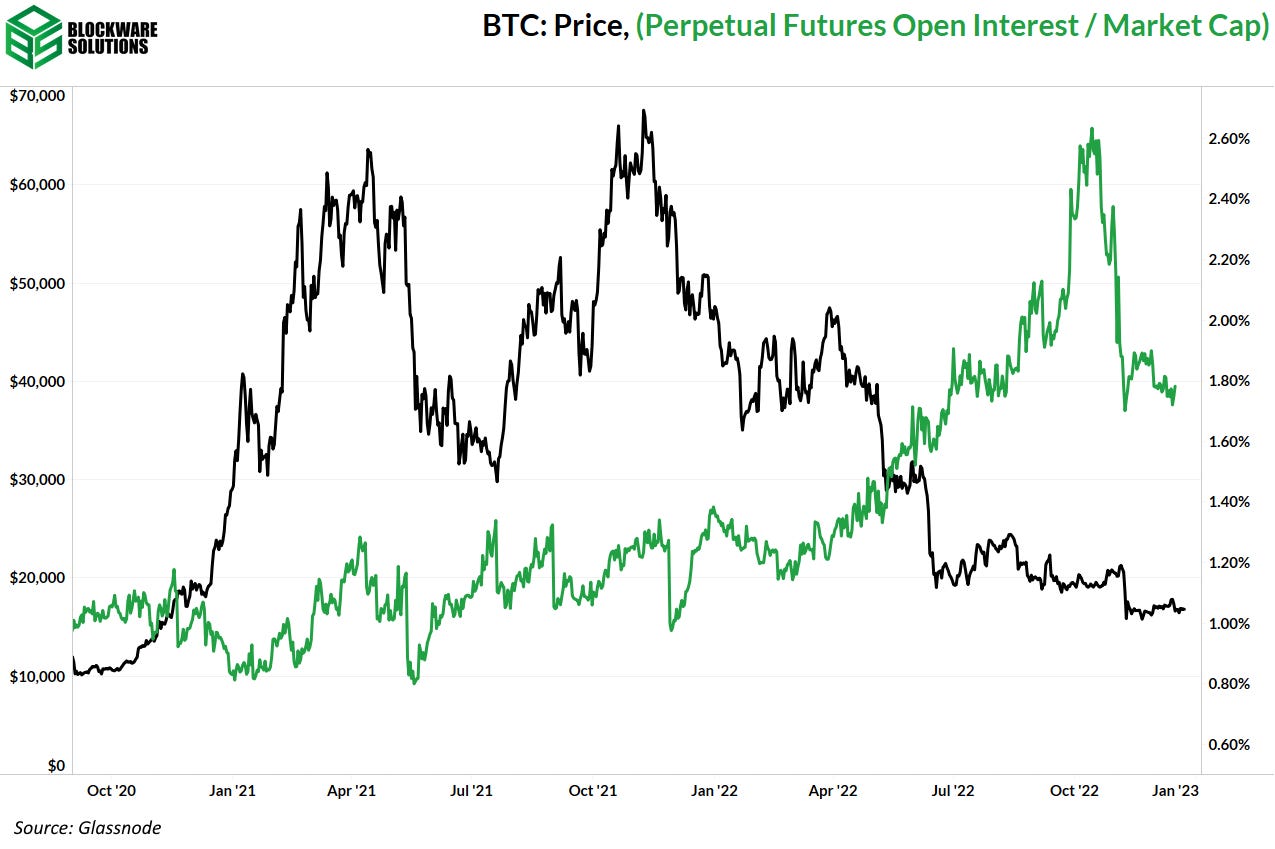
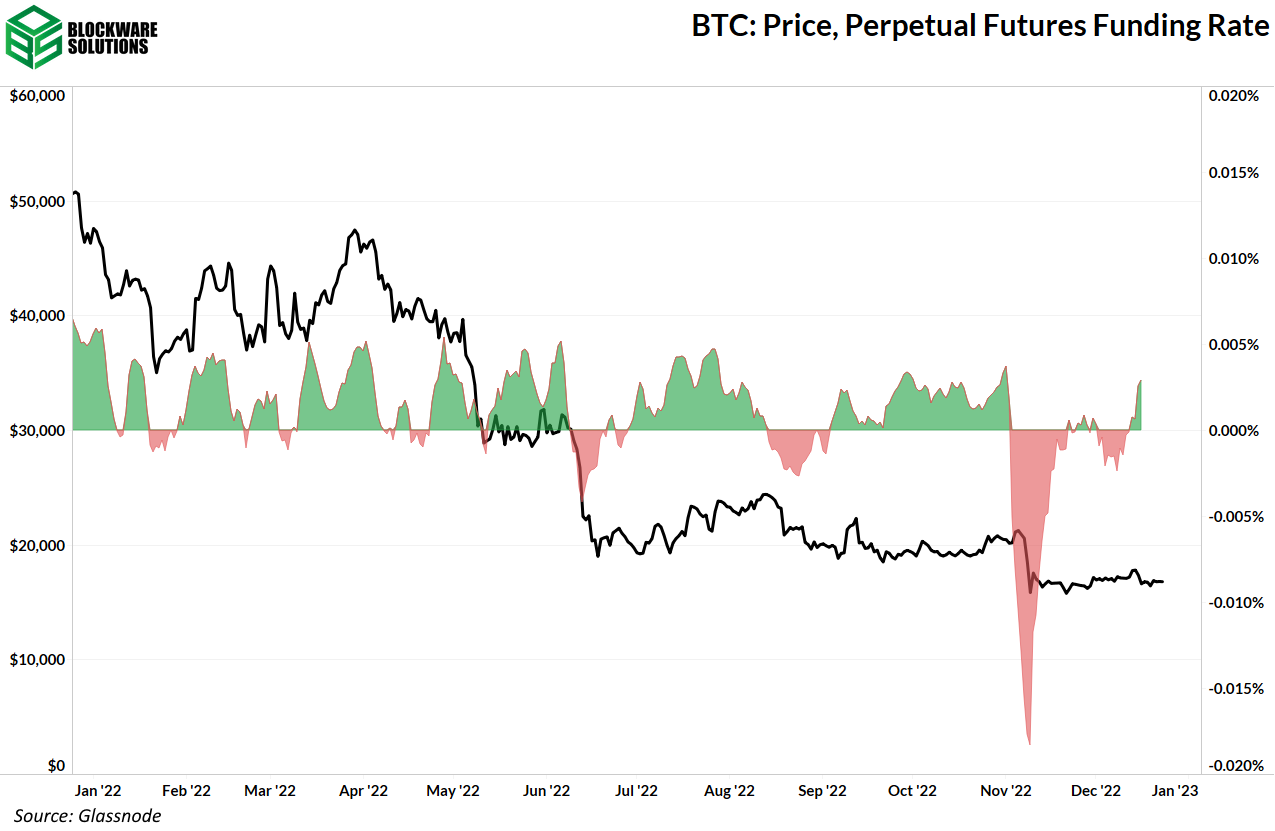
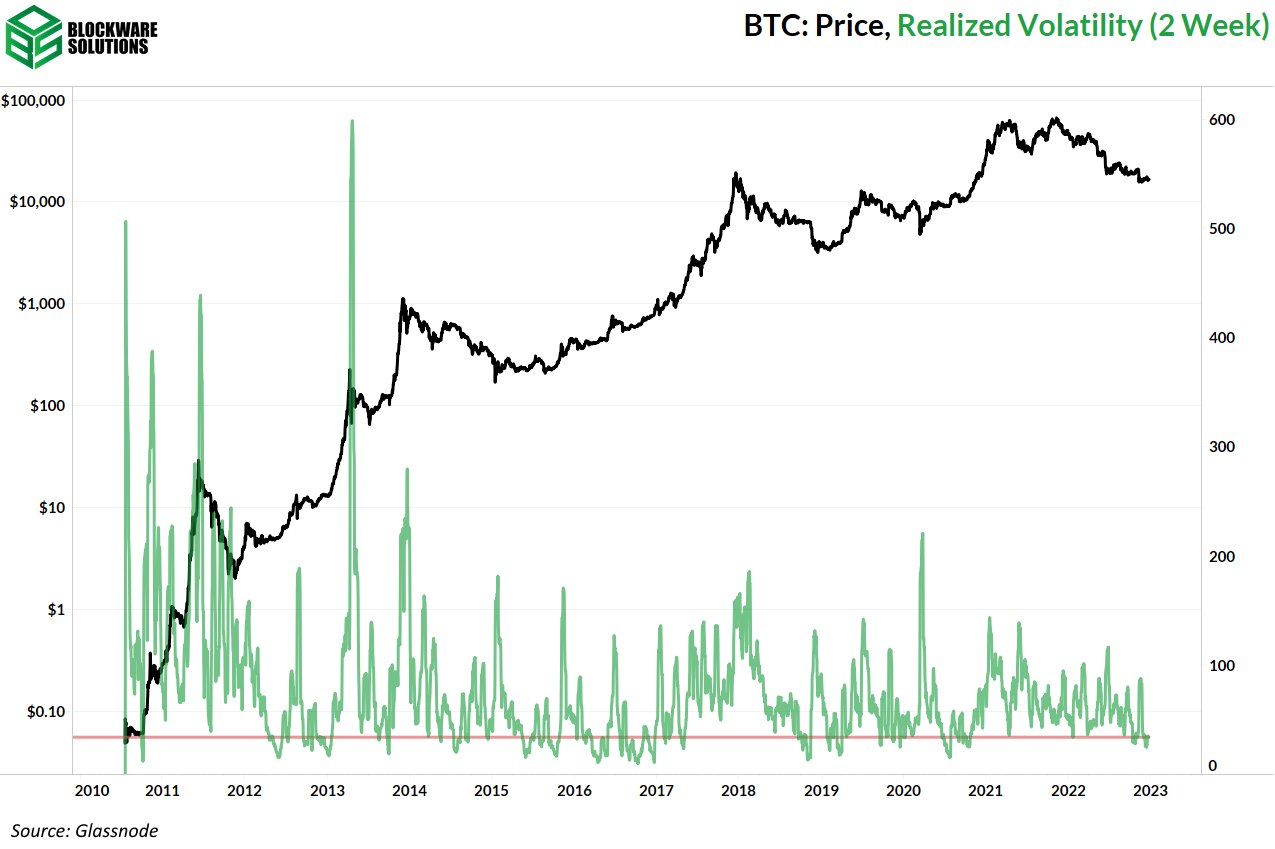
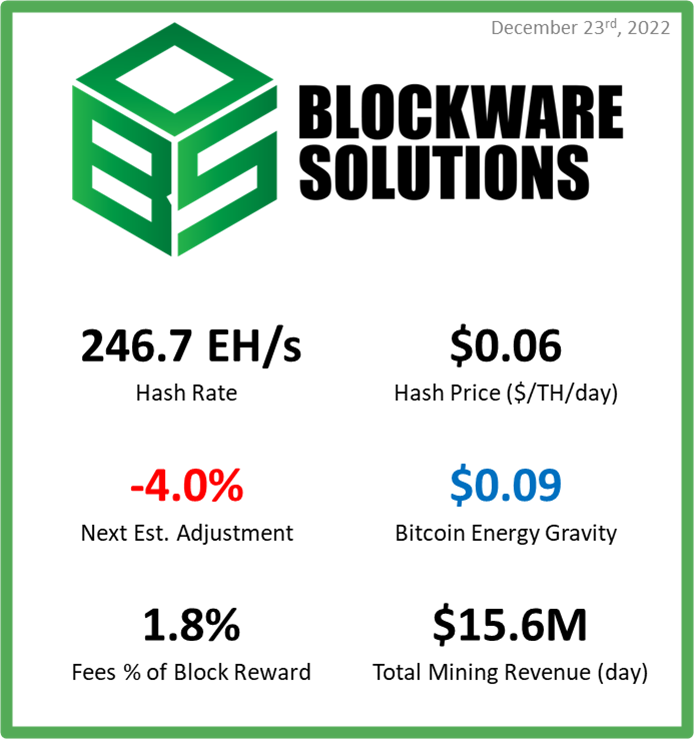
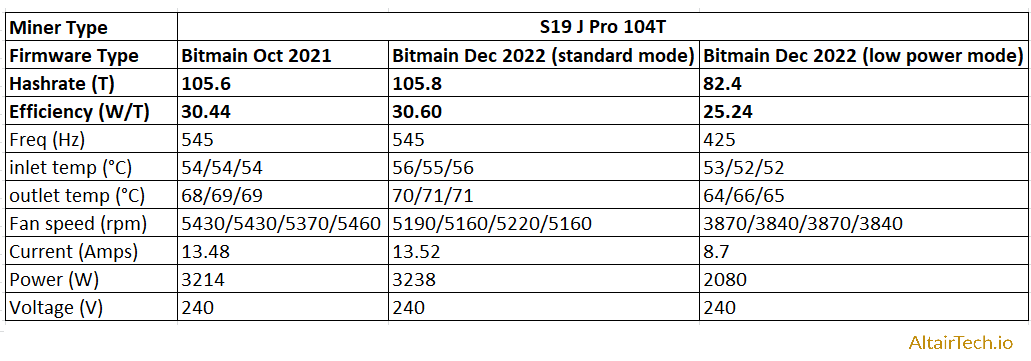
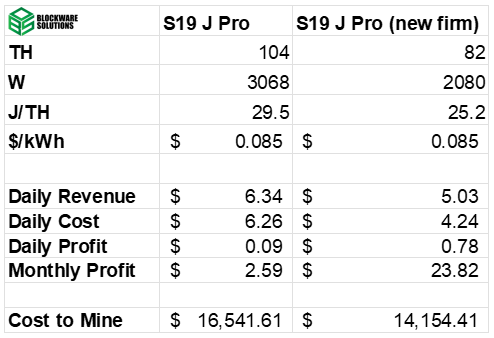
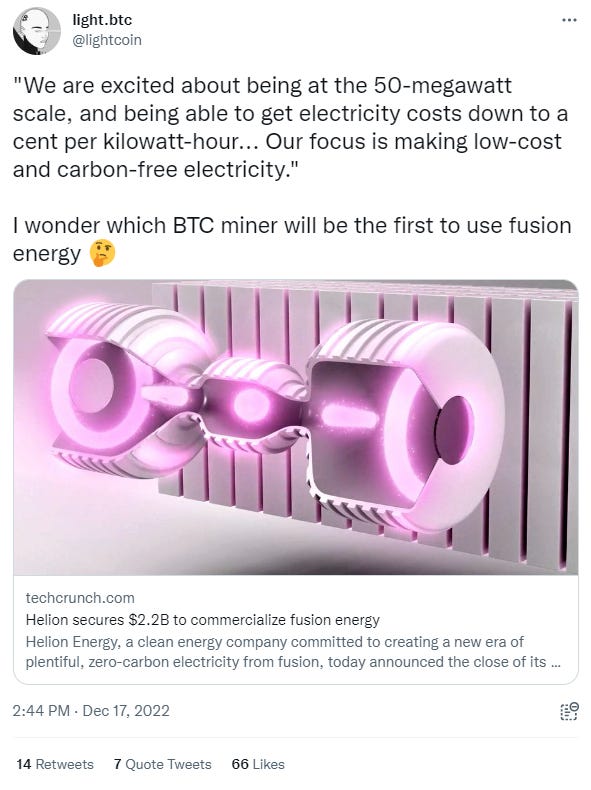
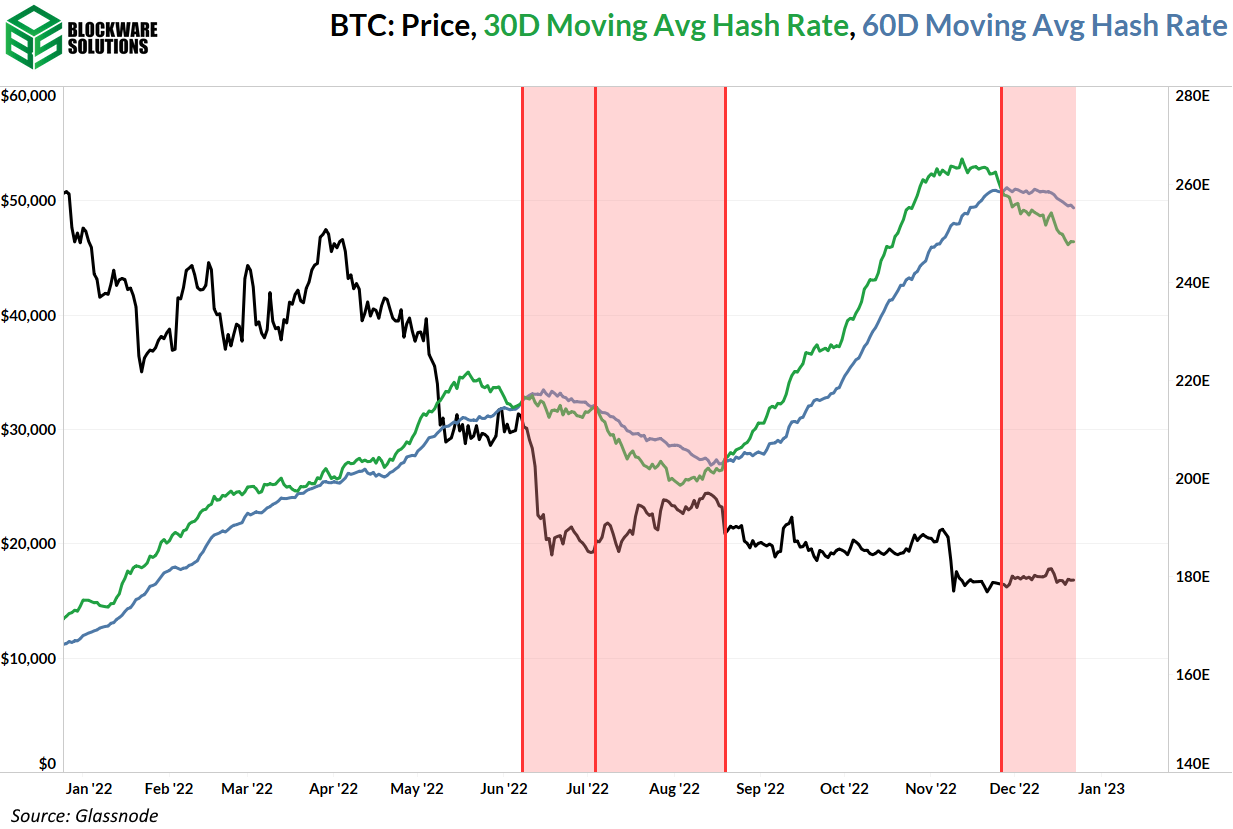
If you’re inclined to believe that the Fed will be forced to pivot early, (a variation of thesis #1), you may be looking at beginning to build longer-term positions here. If instead you believe that inflation won’t be sustainably yielding to current Fed policy, you would likely believe that markets will continue lower in 2023. This newsletter does not provide investment advice, therefore it’s up to the individual investor to formulate an investment strategy that best suits their time horizon, risk tolerance, and the results of their own due diligence. For the reason that not much has significantly changed since last week, we’ll jump right into this week’s price action. This week, we’ve seen a continuation of the volatility generated by last week’s FOMC meeting and CPI data. Nasdaq Composite Index, 1D (Tradingview) As we alluded to in this newsletter last week, the shifting narrative from Fed officials was likely to create another move lower. Thus far, buyers have been unable to gain control beyond Wednesday’s short bounce. This week, the index’s 21-day EMA completed a bearish crossover of its 50-day SMA. As you can see above, this has occurred 3 other times since January 2022, each marking the next significant leg lower. This doesn’t mean that the market is definitely going to head significantly lower here, instead it indicates that the bias is towards lower prices in the near term. On Thursday, the index was able to bounce off a support level discussed in last week’s newsletter around $10,300. Whether or not this level will be held heading into next week is impossible to know for sure. If the market does continue lower, the next support area we see for the Nasdaq lies at the low of November 4th, at ~$10,263. But we find the more likely scenario to be a retest of the YTD lows around $10,088. This level also aligns with the peak the index hit before its first significant retracement off the 2020 lows. If this level is unable to attract significant buy pressure, the century level of $10,000, or the peak before the 2020 COVID crash at $9,838 would be the next two levels that would likely instigate a bounce. Pivoting to the S&P 500, data from the last ~100 years shows that the median bear market had a duration of 355 days (peak to trough) and depth of ~33.5%. As of today (12/23/22), we are 353 days and ~21% into this down cycle (as of Thursday’s close). Interestingly, 353 days is the exact mean duration for bear markets dating back to 1929. This DOES NOT mean that the market has definitely already bottomed, or definitely will in the coming days. Instead, we are sharing this data with the intention of providing historical context. As you can see above, the S&P has seen several bear markets that lasted multiple years, and had >50% retracements. Using historical data to generate predictions of the future tends to be a losing game. 2-Year Treasury Note Yield, 1D (Tradingview) Looking at the Treasury market, we’ve seen a compression in volatility create essentially sideways yield action this week. This indicates to us that “smart money” bond investors don’t believe that the Fed will be able to get rates above 5%, despite the rhetoric from FOMC members and the reaction that equities have had. If yields are to head back higher in the coming sessions, it would likely exacerbate the downside moves currently underway in the major equity indexes and bitcoin. It’s probable that the direction Treasury prices take in the coming days will indicate how the equity indexes will react to a retest of nearby support levels. If yields continue lower, it’s likely that the Nasdaq would bounce at or around either of the next support levels previously identified. On the other hand, if yields move higher, we could see the Nasdaq break through these levels. This, of course, is solely speculation and not investment advice. Crypto-Exposed Equities Generally speaking, we’ve seen a red week for most crypto-related equities. The major news from this industry group came early Wednesday morning with the formal filing of Chapter 11 bankruptcy by Core Scientific (CORZ). The sole act of filing for Chapter 11 does not mean that CORZ is done operating, or their stock is being delisted. Instead, filing for bankruptcy provides a company with protection from debtors and a plan to restructure their existing capital structure. In some ways, this is a good thing for CORZ investors who have heard nothing but rumors and speculation in the last several weeks. That being said, the formal filing obviously injects volatility into a stock. Prepare your eyes for perhaps the ugliest chart in the market. CORZ, 1D (Tradingview) If you recall from last week, a proposed capital restructuring from B. Riley led to a massive 251% jump in CORZ’ share price over the course of 2 sessions. Short sellers were able to retrace some of this move initially, then this week with the formal Chapter 11 filing, CORZ was down over 75% on Wednesday. Thursday saw a large jump in their share price, but ultimately led to a massive 54% downside reversal after running into sellers at the 21-day EMA. At one point on Thursday, CORZ was up 273% from Wednesday’s close. This wasn’t the result of any news, or structural change to CORZ financial situation. Instead it was simply the result of heightened volatility in an extremely illiquid stock that cost less than a quarter per share. Above, as always, is the excel table comparing the Monday-Thursday performance of several crypto-equities. Bitcoin Technical Analysis This week we’ve seen a bit of volatility from bitcoin price action, but this has substantially declined as of Friday morning Bitcoin / US Dollar, 1D (Tradingview) Last week we discussed that we were expecting the Volume Weighted Average Price (VWAP) anchored off the 11/21 lows to be a very likely spot for some buyers to step in. This ended up being the case, as you can see above with the teal line. BTC has bounced slightly since reaching this level, but is currently stuck below its 21-day EMA. In the short-term, BTC is in a spot that makes it very hard to estimate the direction of the next move. After finding support, and now contracting in volatility, it would make sense that we could potentially get another bounce here. That being said, BTC’s 21-day has attracted sellers this week, and there also is the declining 50-day SMA overhead. With these two key moving averages overhead, coupled with the weakness being shown from the equity indexes, it would appear most likely that we have lower prices to come. Of course, this is just speculative and should not dictate the investment strategy of any individuals. Bitcoin Onchain and Derivatives We are still monitoring the cost basis of short term holders as the most important on-chain metric for short-term signal. This metric is a key resistance level as short term holders may look to sell here in order to “break-even.” Flipping this from resistance to support will be an important first step in an overall shift from bear market to a bull market. This metric currently sits at ~$18,300; roughly 9% higher than the BTC price of ~$16,700. Zooming out, many on-chain metrics indicate that BTC is extremely underpriced here if you have a long time horizon. The first of these we will look at is Market Value to Realized Value Ratio (MVRV Ratio). This is a ratio of the BTC price with the average cost basis on-chain (realized price). When MVRV Ratio is less than 1 that signals that, in the aggregate, the market is underwater. MVRV Ratio has been less than 1 for effectively 6 months now which is slightly longer than the 2018 bear market (roughly 5 months), and slightly shorter than the 2015 bear market (roughly 10 months). The total supply of BTC currently being held at a loss by long term holders is at an all time high. This metric gives us two valuable signals. First, like the other metrics show, BTC is extremely cheap at the current price relative to its overall performance history Second, the conviction that long term holders have in Bitcoin has never been stronger. Note how much this metric has increased over the past 6 months. The price has been steadily trekking lower and long term holders keep stacking regardless. Realized HODL Ratio is next. Realized Cap HODL Waves take HODL Waves, a breakdown of the circulating Bitcoin supply based on the last time each coin was moved, and weighs it by what the price was at the time each coin was last moved. Realized HODL Ratio measures the Realized Cap HODL Wave of BTC moved within the last week to the Realized Cap HODL Wave of BTC moved 1-2 years ago. Simply put, this measures the current price to the price of 1-2 years ago whilst factoring in the number of coins moved within each time period. This can show us when BTC is overvalued or undervalued. Right now, it is extremely undervalued. Coin Days Destroyed measures how the number of coins moved on-chain multiplied by the number of days since they last moved. This aligns with moments of mass capitulation or moments of profit taking. We saw a large spike in the 30-day moving average of this metric at the time of FTX’s implosion. This likely signals that anyone scared by the lower price or forced to sell to meet a margin call has now been wiped out of the market. Perpetual futures open interest adjusted for market cap has continued to slowly trickle down over the past week. Diminishing leverage is a good sign as it shows short-term focused traders are getting squeezed out of the market; leaving only the HODLers. Relative to the market cap, there is still a high amount of leverage remaining but the downward trend is good to see. Following a prolonged negative regime, the funding rate is back positive. This means that long positions have to periodically pay a small fee to short positions, incentivizing people to take the short side of the trade. It’ll be interesting to see if the funding rate can remain positive and, if so, for how long. This back and forth funding rate, flipping between positive and negative, suggests traders are uncertain about which direction the price will head in the near term. Lastly, there’s been no significant change in realized volatility since last week’s newsletter. When you combine that fact with the diminishing volume in the futures market that shows the market is certainly in a much healthier position now than it was a month ago. The kind of behavior we should expect to see at the bottom of a bear market is fear from speculators, shown in the form of low volume and/or negative funding rates, as well as low, but accelerating on-chain transaction activity, and accumulation from long term holders. Bitcoin Mining CORZ Files for Bankruptcy As previously mentioned, last week, B. Riley published a letter to attempt to help CORZ avoid bankruptcy, but it seems that the proposed restructuring has fallen through. CORZ equity holders may end up with nothing and CORZ credits will likely take possession of Core Scientific’s assets. Core Scientific didn’t fail because all of its assets are cash flow negative. CORZ failed because it took on far too aggressive amounts of leverage at rather high interest rates. Many of Core Scientific’s assets are cash flow positive without the interest payments and debt overhang. Because of this, it is likely that many of the mining rigs Core possesses that are currently operating will likely remain operating. This particularly should not lead to a material drop in difficulty as they won’t turn off the machines. New S19 J Pro Firmware Altair Technology published a short Twitter thread on their results testing a new S19 J Pro firmware. This firmware runs the rig in a “low power” mode, which means hashrate will drop by ~ 20%, but power draw will also drop by 35.7%. This means the machine can now run at an efficiency of 25.5 W/TH. This gets rather close to the current efficiency of the S19XP which runs at 21.5 W/TH. Looking at the table above, the new firmware makes a material difference for miners operating at market hosting rates. Without the new firmware, the S19 J Pro operating at an 8.5¢ per kWh earns ~ $2.59 in monthly profit. With the new firmware, the same machine earns ~ $23.82 in monthly profit. That’s a material difference considering many J Pros are on the verge of just breaking even. This is a great bear market strategy for struggling miners, and if enough miners begin running this new firmware, it would be reasonable to expect a drop in total network hashrate and mining difficulty. Bitcoin Mining Explosion Over The Next 10 Years 2022 was a treacherous year for Bitcoin miners. The price of BTC, global energy prices, and mining difficulty all went in the wrong direction and squeezed the most inefficient miners out of the market. With that said, the rest of the decade looks incredibly bright for this industry. There are two key reasons why the Bitcoin mining industry is set to flourish over the next 10 years. 1. The world is in the early stages of actively monetizing BTC. 2. Energy production will become more efficient and cheaper. A higher BTC price and less expensive energy is the perfect storm for the Bitcoin mining industry to explode. For Bitcoin to just reach gold parity, it needs to trade at $500,000 per coin, over 50x higher than where it trades today. If Bitcoin traded to that level today, a massive amount of capital would flood into the mining industry as nearly everyone could start up a profitable Bitcoin mine (until the price fell or mining difficulty increased). At the same time, high energy prices today are encouraging more energy production tomorrow. This is a slow process, but we can certainly expect more companies to be building out energy production facilities in order to capture profits from high energy prices. Additionally, technology is going to continue to bring efficiency breakthroughs to the energy industry. Whether it is fracking with oil and gas or something completely revolutionary like nuclear fusion, society is going to become more and more efficient at producing cheap clean energy over time. This is a perfect storm for the Bitcoin mining industry to explode over the next 10-20 years, as a high BTC price paired with abundant cheap energy will lead to an unprecedented explosion in the Bitcoin mining sector. Miner Capitulation The second wave of miner capitulation started at the end of November, and it remains in a fairly strong downtrend. As of now, we’re expected to see another negative difficulty adjustment at the start of 2023. Much of this is likely due to high energy prices (cold weather) curtailing miners and ongoing financial struggles for various companies. Something that could further reduce total network hashrate over the next 30 days is miners starting to run the new “low power” mode firmware from Bitmain. At current BTC and mining difficulty, any J Pro would be economically incentivized to run the new firmware if their energy expenses are greater than 5.6¢ per kWh. All content is for informational purposes only. This Blockware Intelligence Newsletter is of general nature and does consider or address any individual circumstances and is not investment advice, nor should it be construed in any way as tax, accounting, legal, business, financial or regulatory advice. You should seek independent legal and financial advice, including advice as to tax consequences, before making any investment decision.
Read Blockware Intelligence Newsletter in the app
Listen to posts, join subscriber chats, and never miss an update from Blockware Intelligence.
© 2022 William Clemente III |


