Blockware Intelligence Newsletter: Week 158
Blockware Intelligence Newsletter: Week 158Bitcoin on-chain analysis, mining analysis, macro analysis; overview of 12/14/24 – 12/20/24
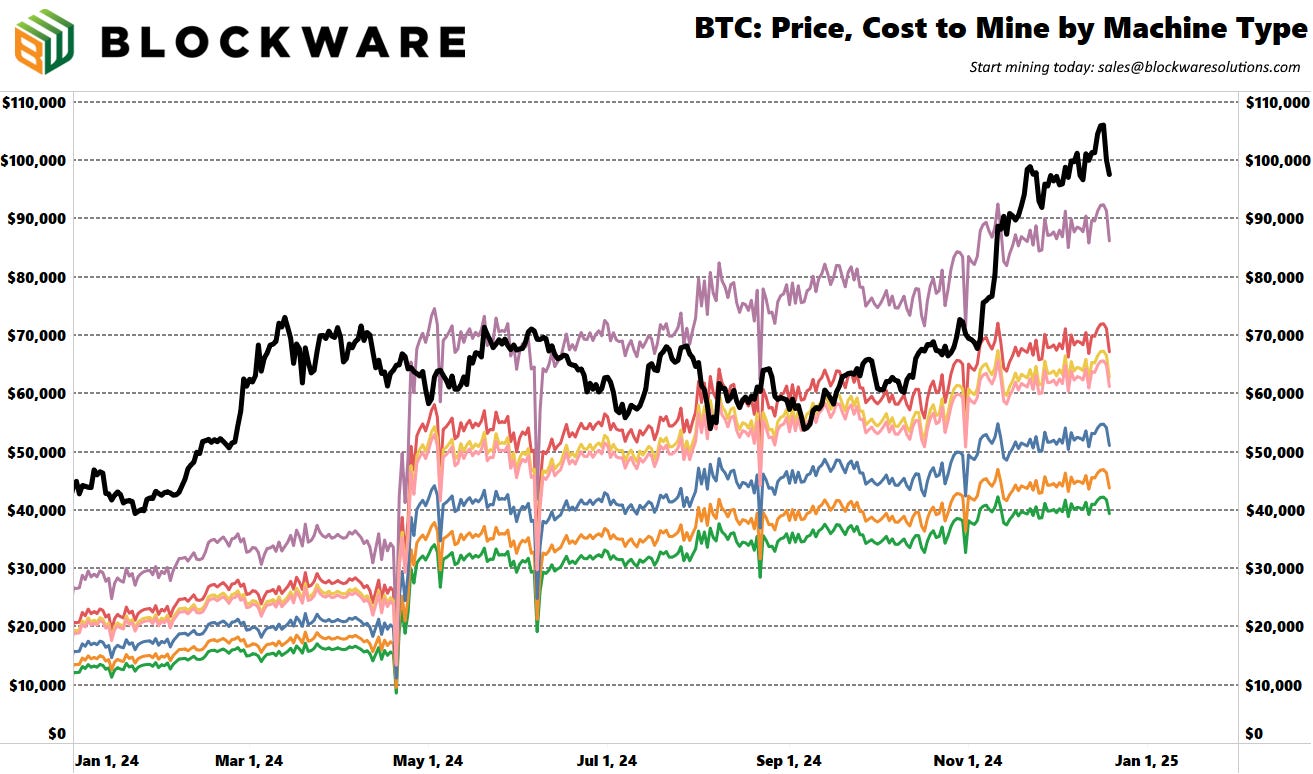
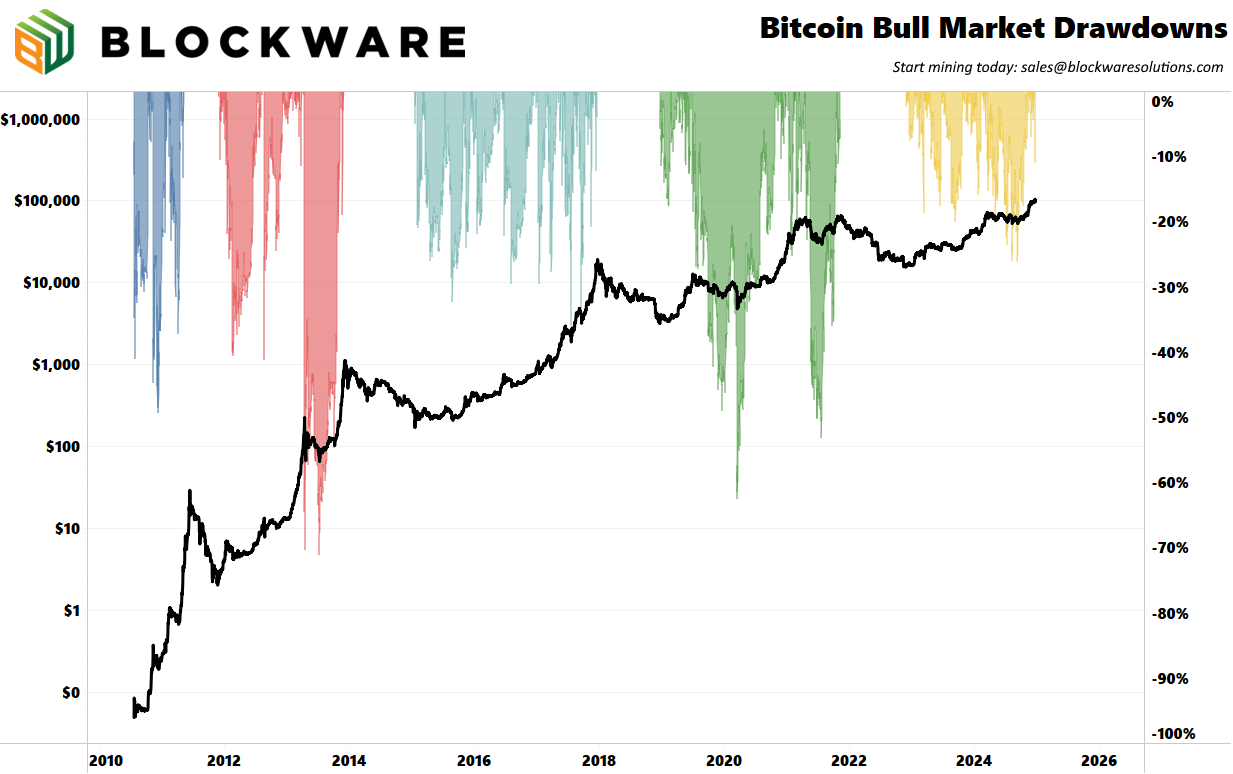
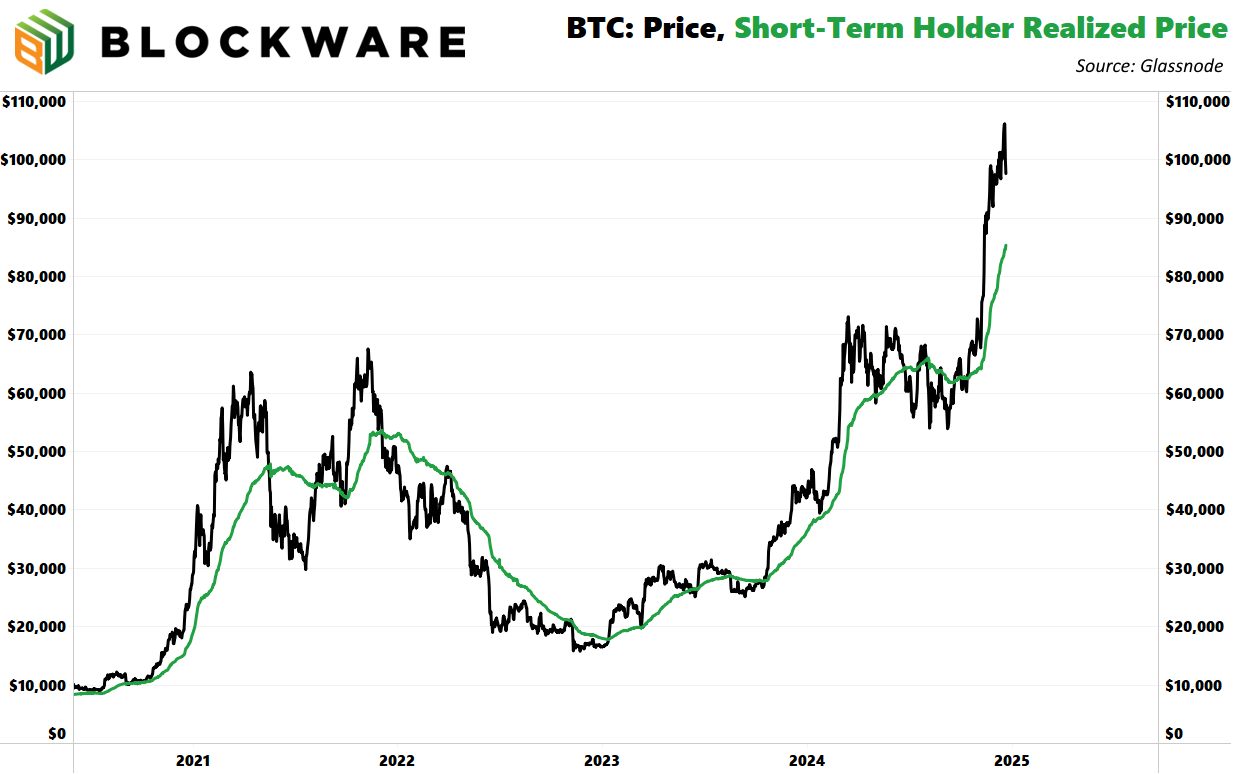
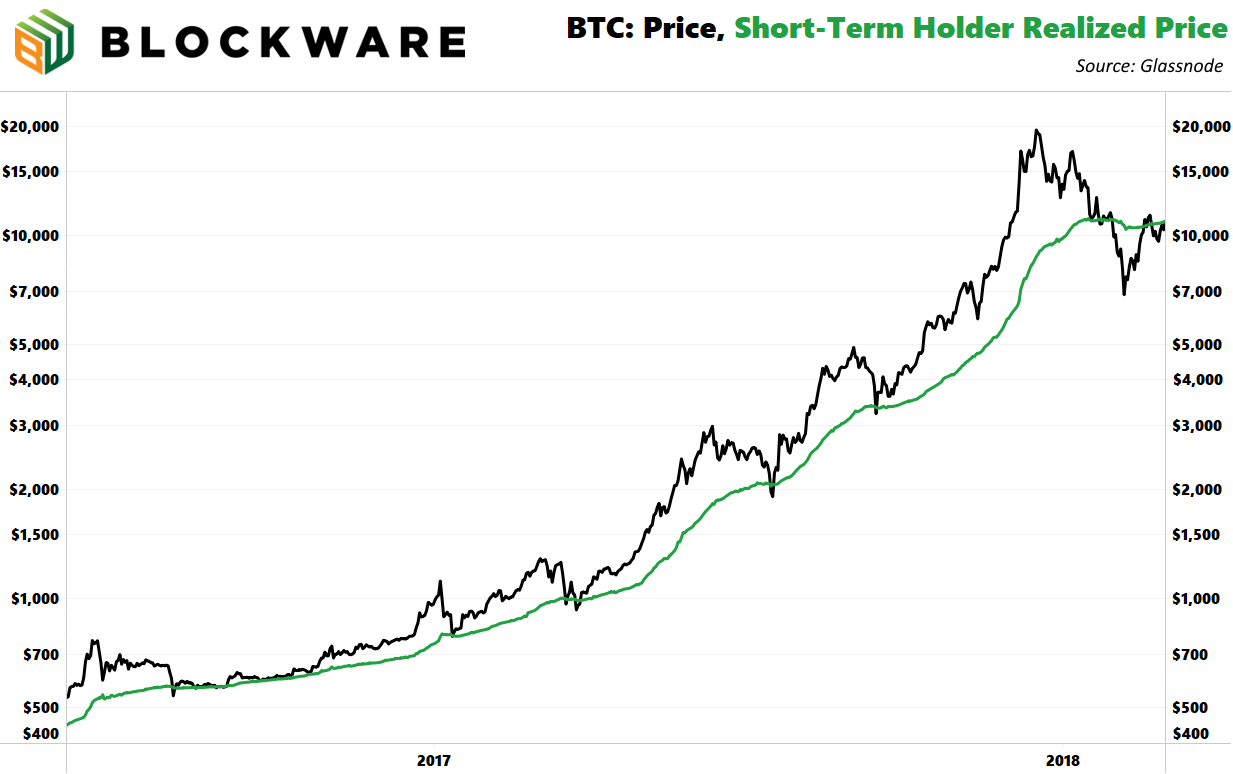
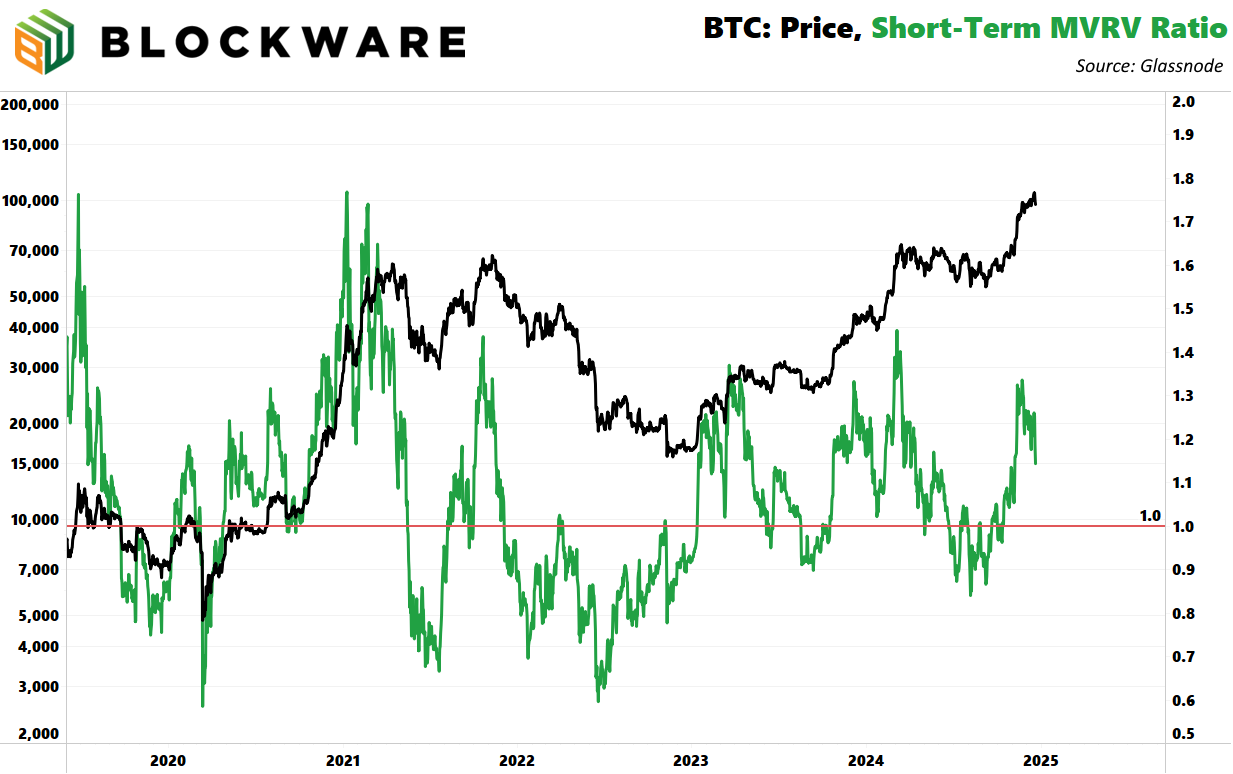
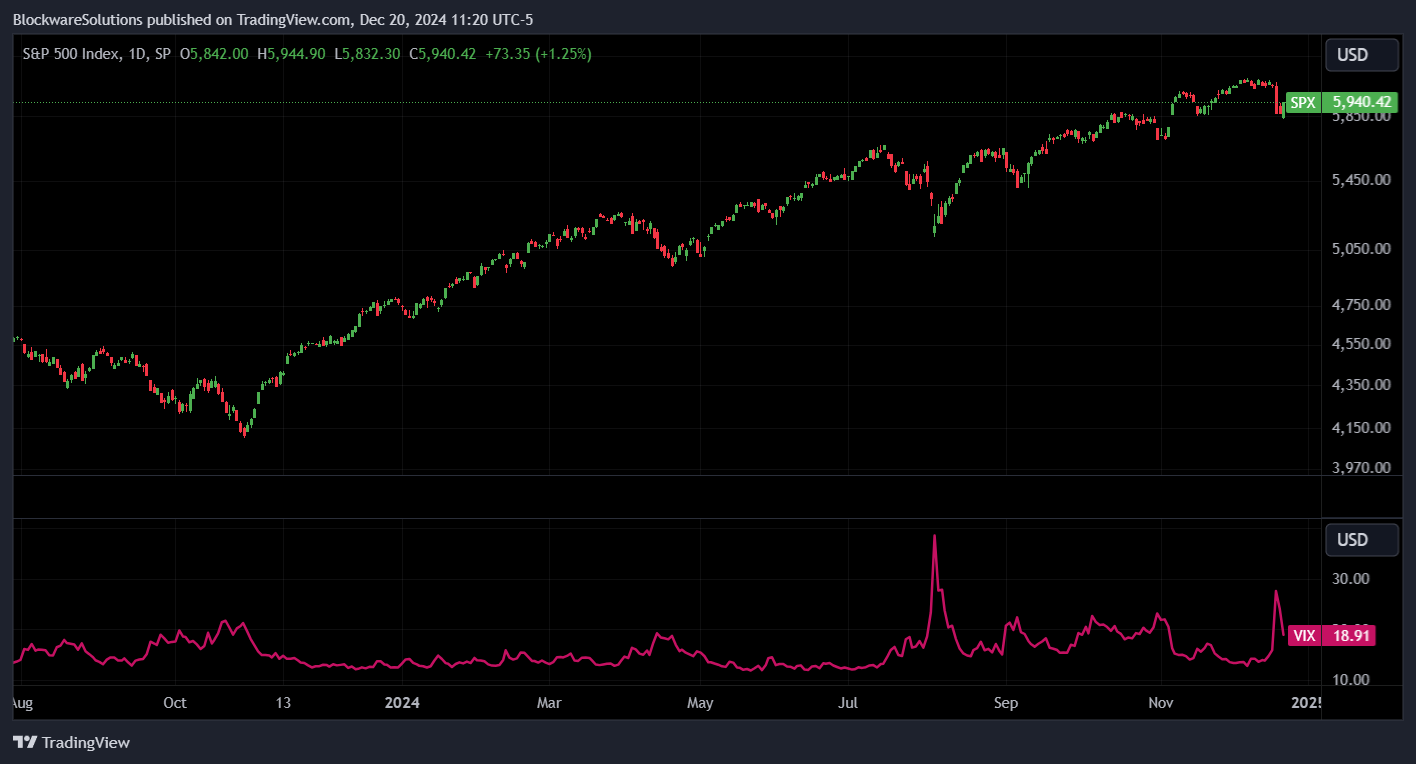
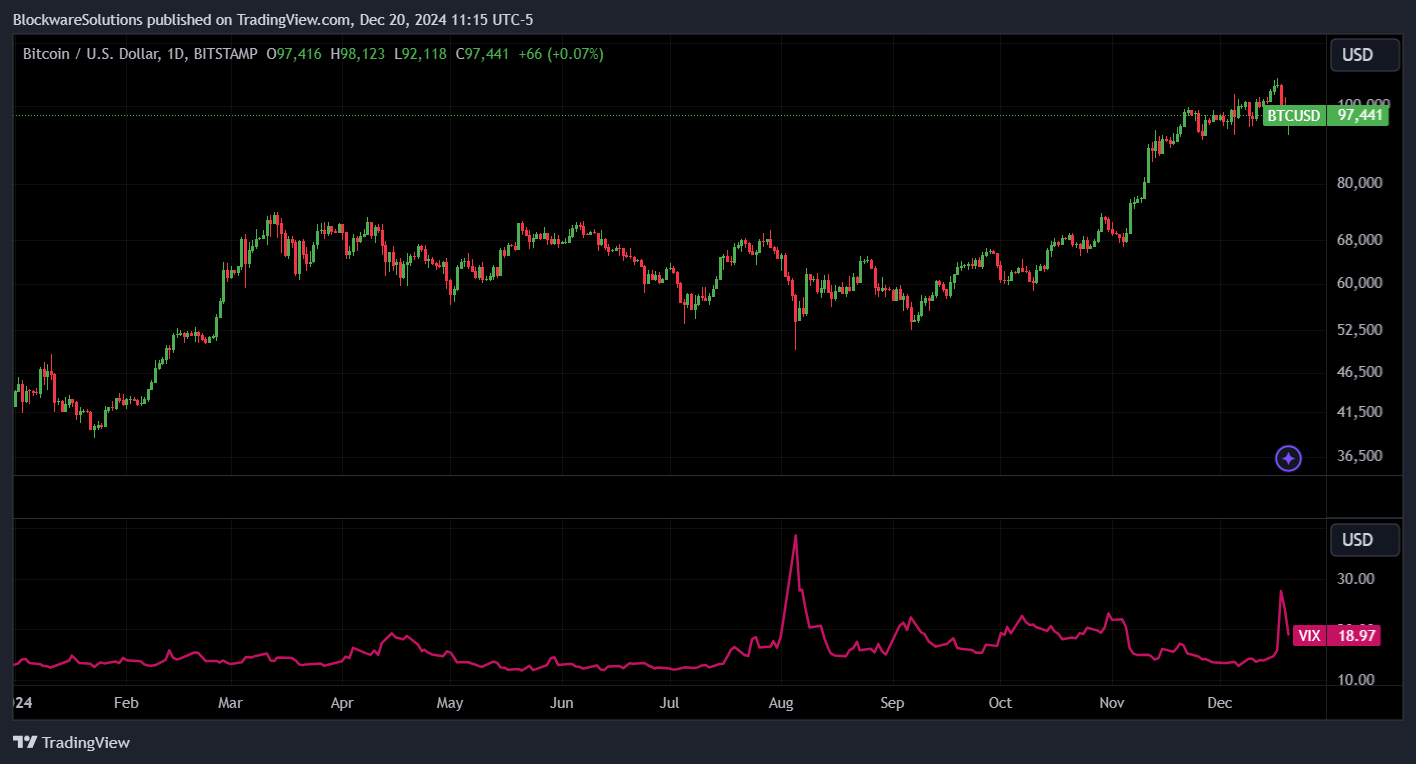
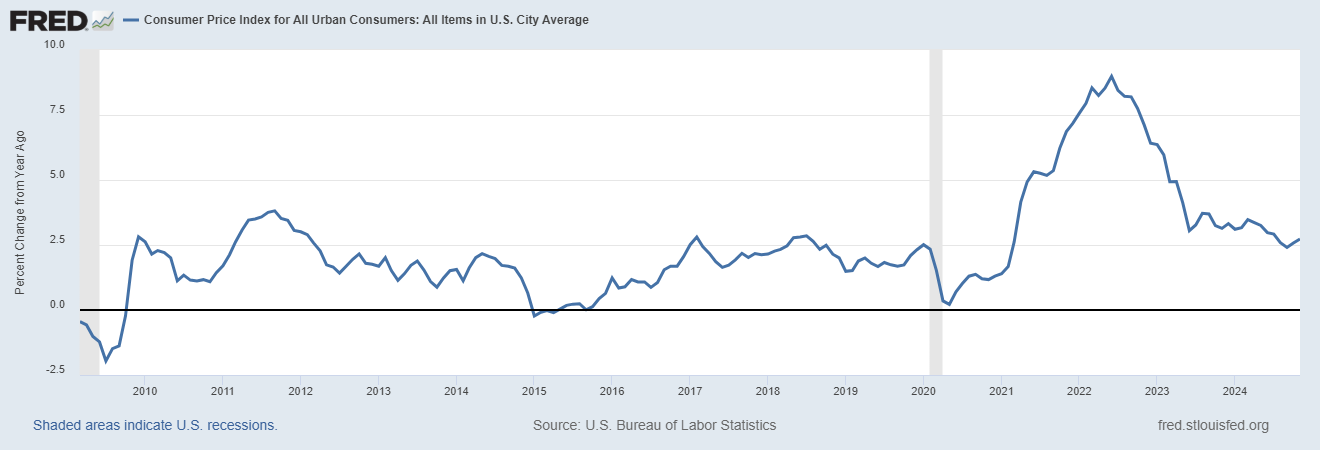
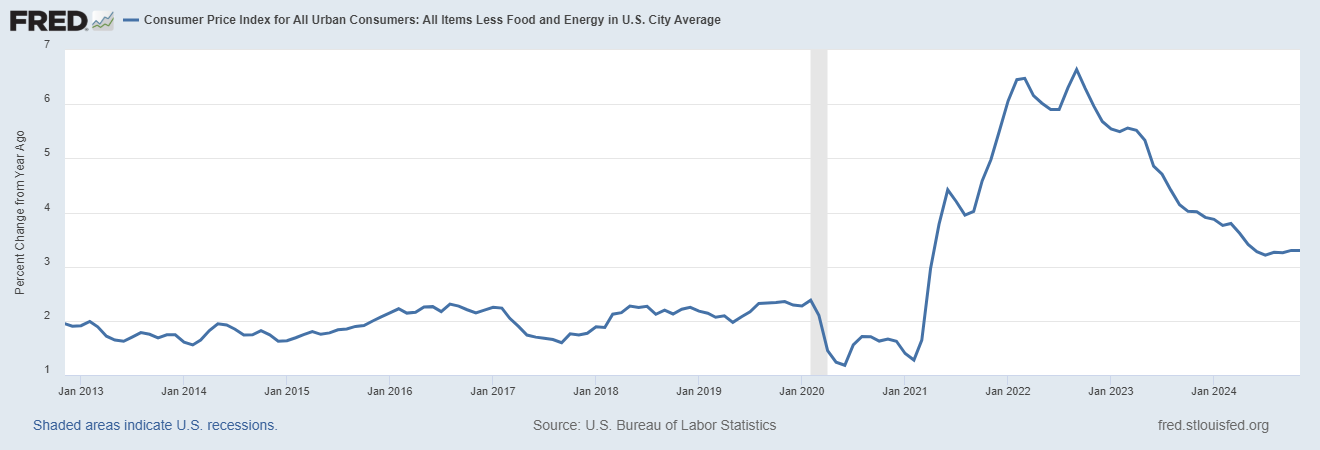
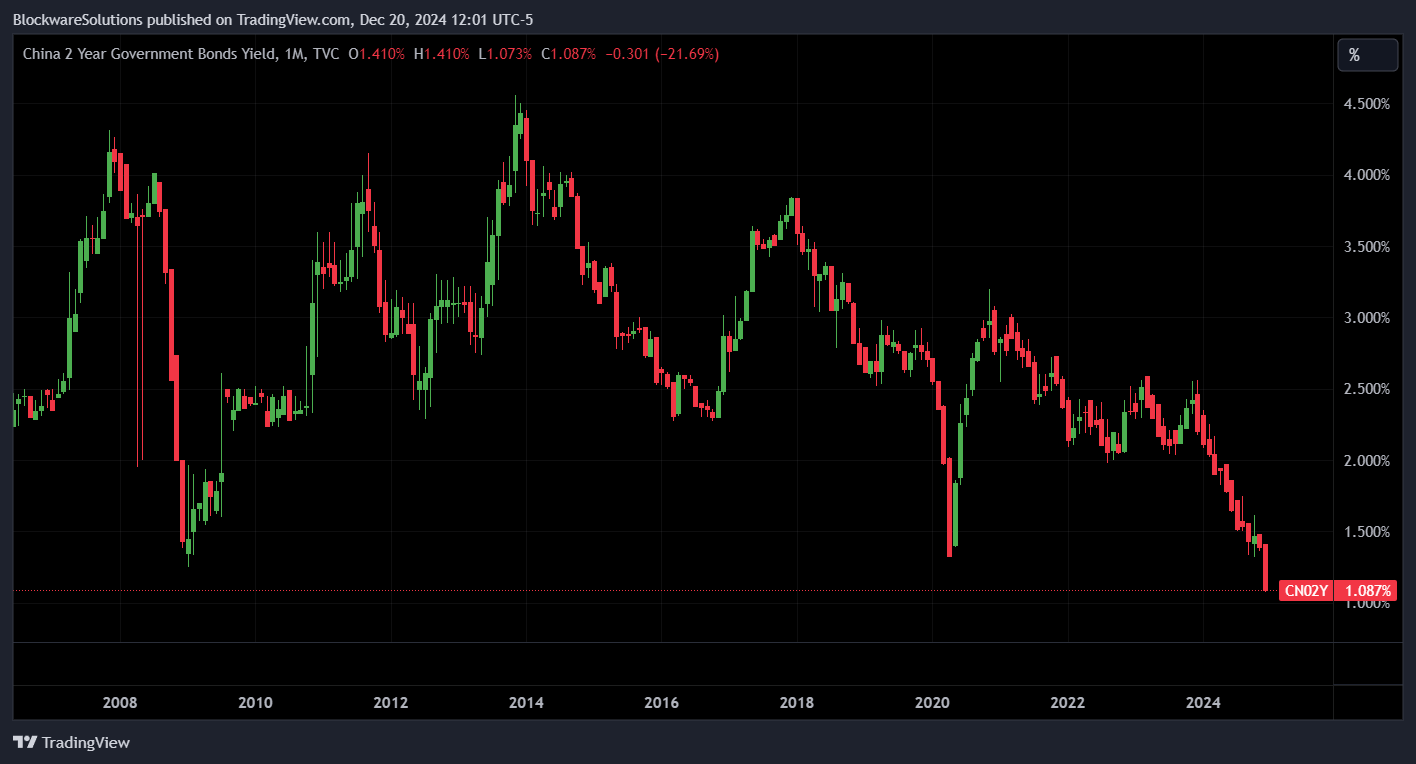
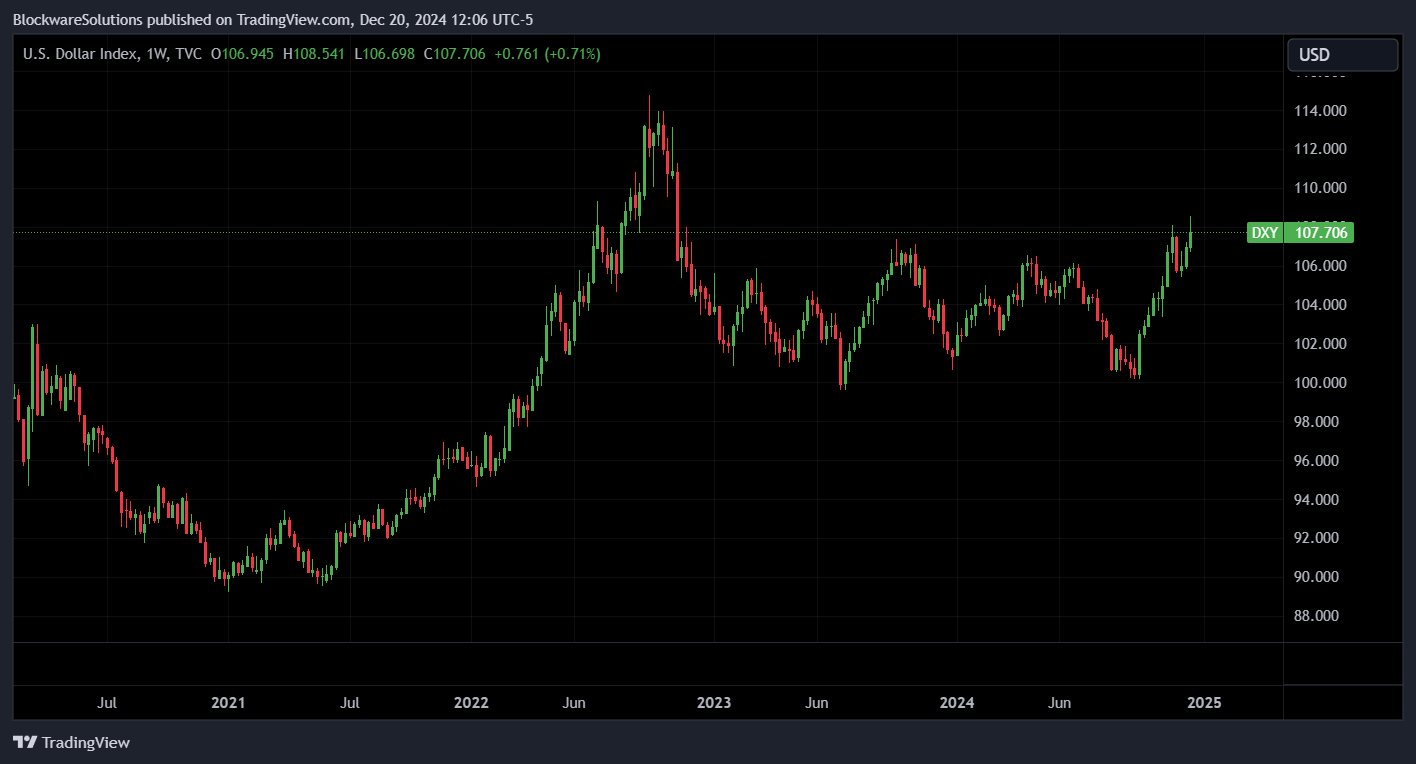
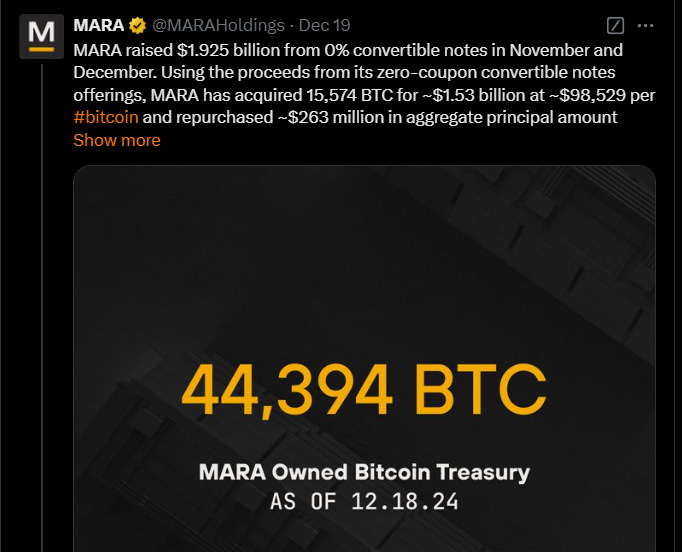
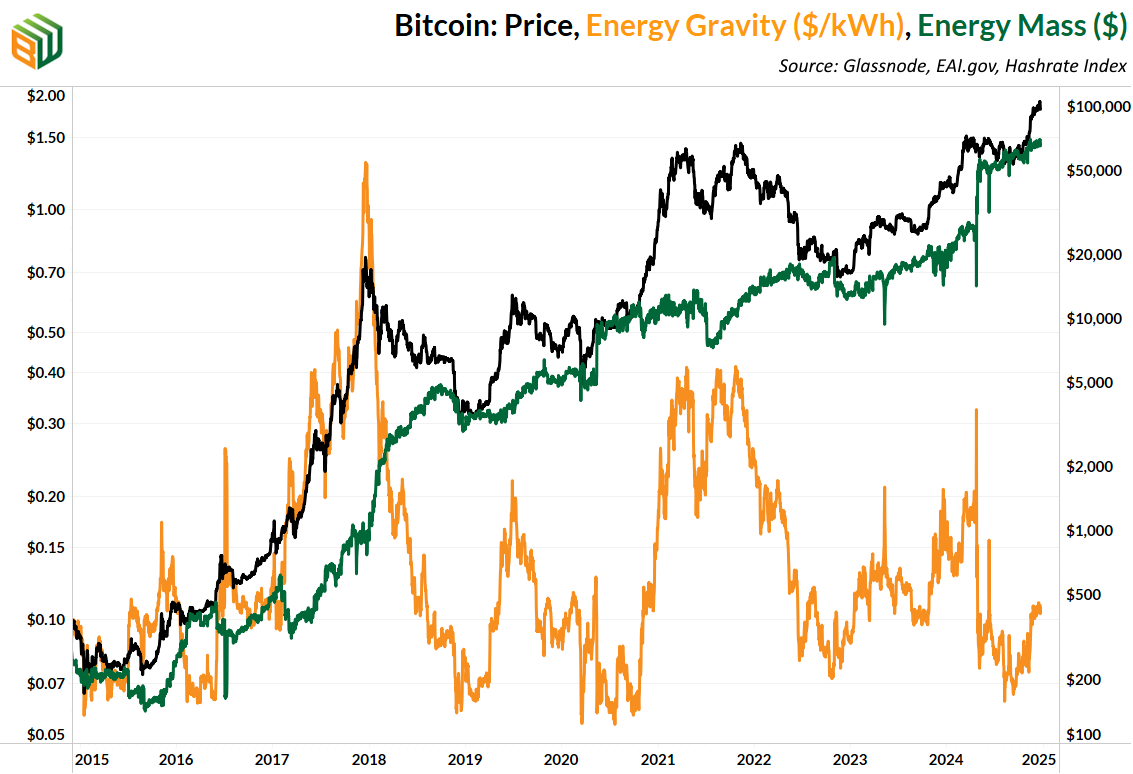
It costs $97,000 to buy 1 Bitcoin. It costs $40,000 to mine 1 Bitcoin. Start Mining Today with the Blockware Marketplace. Bitcoin: News, ETFs, On-Chain, etc. 1. Bitcoin Falls Below $100,000 – is the party over? Not in the least. Drawdowns of this magnitude are typical for Bitcoin bull markets. While ‘up-only’ is a popular mantra, that’s not actually how bull markets play out. In 2017, BTC increased by ~1,792% from January to its peak in December. During that time period, there were TEN drawdowns of 10% or more, and FIVE drawdowns of 20% or more! Below we’ll dive more into the trigger for this short-term pullback, but the signal here is that dips are great opportunities to deploy additional capital into the market. 2. Short-Term Holder Realized Price: The ‘Floor’ is Rising The cost-basis of short-term holders (BTC addresses whose coins have moved within the past ~six months), has been on a meteoric rise over the past two months. The “cost-basis” for this cohort of holders is now ~$85,000. This is a helpful metric to track when examining the potential range of pull backs because it provides a rough estimate as to the “breakeven” price of traders. During bull markets, these cohorts will buy at their cost-basis, providing support to the market. It’s yet to be determined if this behavior will change now due to many new market participants purchasing Bitcoin through ETFs – rather than buying coins directly from exchanges and moving them to self-custody. Moreover, the investor-base of Bitcoin is slowly shifting to a more sophisticated capital allocator: “investors” rather than “traders.” Or in other words, institutions that are net-buyers of assets during all types of markets, rather than speculative traders who are quick to hit the sell button during drawdowns. Despite this not being a perfectly accurate measure of cost-basis, it still provides a good rough estimate. Here you can see how this metric was ‘support’ during the 2017 bull market. We’ll keep an eye on this throughout 2025 to see if this holds true – but for now, we’ll assume that a dip below $85,000 is off the table. 3. Short-Term Holder MVRV Ratio The “market value to realized value” ratio of short-term holders is an off-handed way of looking at the same thing as above – this measures the net unrealized profit/loss of short-term holders. Here’s a rough outline of cyclicality to pay attention to: > BTC Price Rises > Short-term holders “take profits” > Sell pressure causes BTC price to fall > Short-term holders re-accumulate during sideways/chop > BTC Price Rises… Short-term holders are satisfied with lower returns than long term holders. IE. a long-term holder typically waits for at least a 10x before distributing large quantities of supply into the market. Short-term holders (inherently) are far less patient, typically realizing profits anywhere from 20 to 40%. With the more ‘sophisticated’ / more risk averse / institutional investors entering the market this time around, this could become even more of the case. 40% gains are pennies for Bitcoiners – but that’s a jackpot for someone coming from traditional financial markets. It’s possible that this bull market features short-term jumps in the ball park of 25 to 50%, followed by periods of sideways consolidation. If you zoom out back to the start of this run in early 2023, this is exactly what’s happened. Our base case is consolidation until the inauguration of President Trump on January 20, 2025 – followed by a move up or down in response to his follow through (or lack thereof) on a strategic Bitcoin reserve (and also the speed with which legislation and/or an executive order takes place). We believe follow through is highly likely. And even if it doesn’t take place, other nation-states are buying Bitcoin preemptively to secure their stockpile prior to that inevitable day. General Market Update 4. 2nd Most Volatile Day of the Year ($VIX) The S&P 500 index plummeted on Wednesday as Powell (somewhat) pulled the reigns on previously dovish talk and actions. The Fed proceeded to cut interest rates by another 25 basis points – however, the Fed talked down the markets cutting expectations for 2025. Cuts are still expected, but fewer than previously priced into the market, with the Fed citing strong economic data . All markets reacted accordingly – not just Bitcoin. Treasury bond yields rose and major stock indices plummeted. (S&P 500 + $VIX) pictured below. The previously most volatile day of the year was back in August when a strengthening Yen forced an unwinding of the ‘yen carry trade’ (short Yen, long USD or US Equities). This day happened to mark a local bottom for the Bitcoin price. It’s highly likely that this is the case again this time around – the fundamentals for Bitcoin right now are too bullish to expect the market tides to turn entirely. Monetary policy expectations have recalibrated and the coast is now clear (especially true considering there’s only 1 more Fed meeting for the next 3 months). 5. Inflation is STICKY The prevailing narrative as to why Powell plans on cutting interest rates less than previously projected is due to strength in the economy and rising productivity. However, it is our belief that the primary reason is due to the discontinuation of deflation. Or in more simple terms, rising inflation is a MAJOR RISK. The ‘consumer price index’ declined for six consecutive months but that trend has broken with two consecutive months of rising CPI. Why is CPI rising?
This is known as fiscal dominance. The Fed’s goal of 2% CPI is being actively worked against through the large (and arguably unstoppable) force that is government spending.
Consumer spending is on the rise as asset holders have seen a large increase in their nominal wealth in 2024. Inflation affects asset prices first. Then, as the asset holders become wealthier they begin to spend more on goods and services, which results in higher consumer price inflation. Bitcoin & US Stock Indices hitting all-time highs this year has increased the spending power of asset holders and we’re beginning to see that reflected in consumer spending/price data. 6. Core CPI Even more concerning in that regard is core CPI. These charts may look similar but they provide somewhat different insights. Core CPI disregards food & energy prices from the calculation. Sounds stupid, right? Everybody eats food, heats their home, and drives a car. And that’s correct! Core CPI is a terrible way to measure the actual increase in the cost of living. BUT… this is useful for measuring the impact of monetary & fiscal policy on prices. The price of food and energy can also be impacted by the production or lack thereof of those commodities – they are not exclusively impacted by actions from Fed / Treasury actions. By excluding food & energy from the calculation, you can see more clearly how monetary & fiscal policy is impacting prices. And Core CPI tells a clear tale: prices are continuing to rise above the Fed’s desired level. Core CPI will be important to watch once Trump is elected, because his commitment to increasing energy production (a good thing!) could cause headline CPI to fall, while Core CPI may remain elevated. 7. Rates in China Hit Record Lows While rates in the United States have remained elevated (and will for the foreseeable future), that’s not the case in other markets. In fact, the 2-year yield on Chinese treasuries has hit its lowest level on record, passing the previous lows from 2008 and 2020. Both of these precede massive bouts of quantitative easing (money printing). Chinese investors are clutching their pearls in anticipation of a tsunami of money printing. 8. $DXY If President-Elect Trump hopes to increase on-shore manufacturing as stated, he’s going to need US rates to fall and relative dollar strength ($DXY) to fall as well. The DXY is at its highest level since the equity/bitcoin bear market bottom in Q4 2022. With this in mind, it’s amazing that BTC & Equities have performed as well as they have recently. If we see a reversal in the rising $DXY that will bode even better for Bitcoin – but it’s also possible for Bitcoin to continue its bull market even with a strengthening dollar. Bitcoin Mining 8. Public Mining Companies Tripling Down The public Bitcoin miners are raising BILLIONS via convertible notes in order to SMASH BUY bitcoin – $MARA: $1,925m at 0% – $CLSK: $650m at 0% – $RIOT: $594m at 0.75% For a detailed breakdown on what this means, why & how they’re doing this, and what it means for mining as an underlying business, check out this video from Blockware Head Analyst, Mitchell Askew. 9. Energy Gravity At a typical hosting rate today, the average miner requires ~$65,000 worth of energy to produce 1 BTC (green line). The orange line shows how many $ (output) miners are able to earn for each kWh of power (input). This metric is different from the chart at the top of the newsletter. This one looks at the aggregate cost of production (combination of all miners) while the former chart breaks it down by machine type To learn more about Energy Mass & Energy Gravity, read our report here. All content is for informational purposes only. This Blockware Intelligence Newsletter is of general nature and does consider or address any individual circumstances and is not investment advice, nor should it be construed in any way as tax, accounting, legal, business, financial or regulatory advice. You should seek independent legal and financial advice, including advice as to tax consequences, before making any investment decision. Blockware Intelligence Newsletter is free today. But if you enjoyed this post, you can tell Blockware Intelligence Newsletter that their writing is valuable by pledging a future subscription. You won’t be charged unless they enable payments.
© 2024 Blockware Solutions |

 Why AI Agents Matter