Blockware Intelligence Newsletter: Week 65
Blockware Intelligence Newsletter: Week 65Bitcoin on-chain analysis, mining analysis, macro analysis; overview of 11/19/22-11/23/22
Blockware Intelligence Sponsors If you are interested in sponsoring Blockware Intelligence email: sponsor@blockwaresolutions.com.
Summary
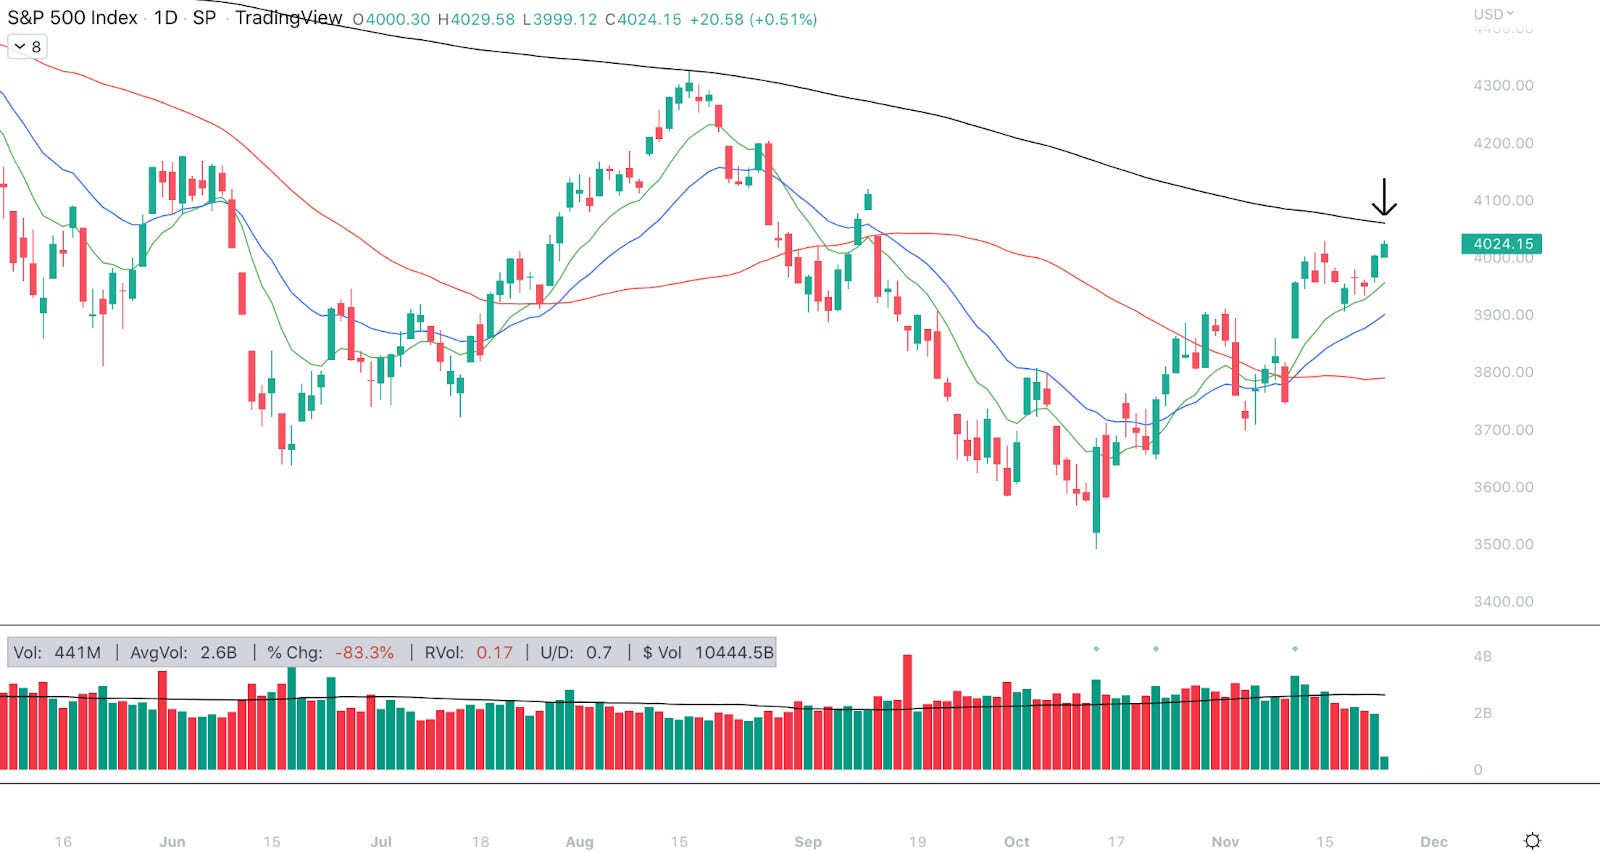
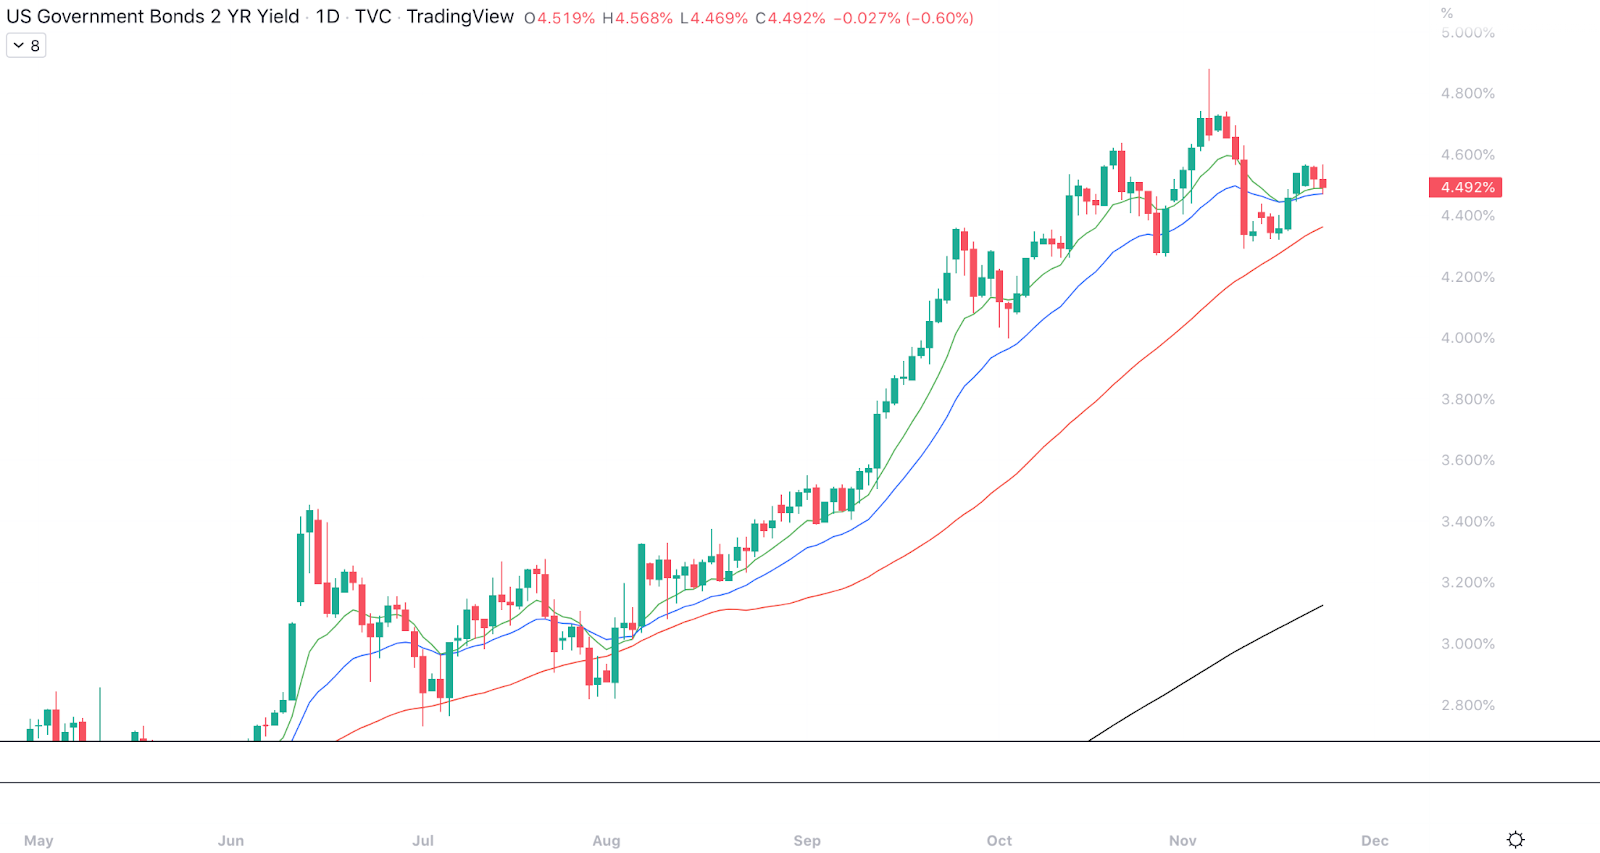
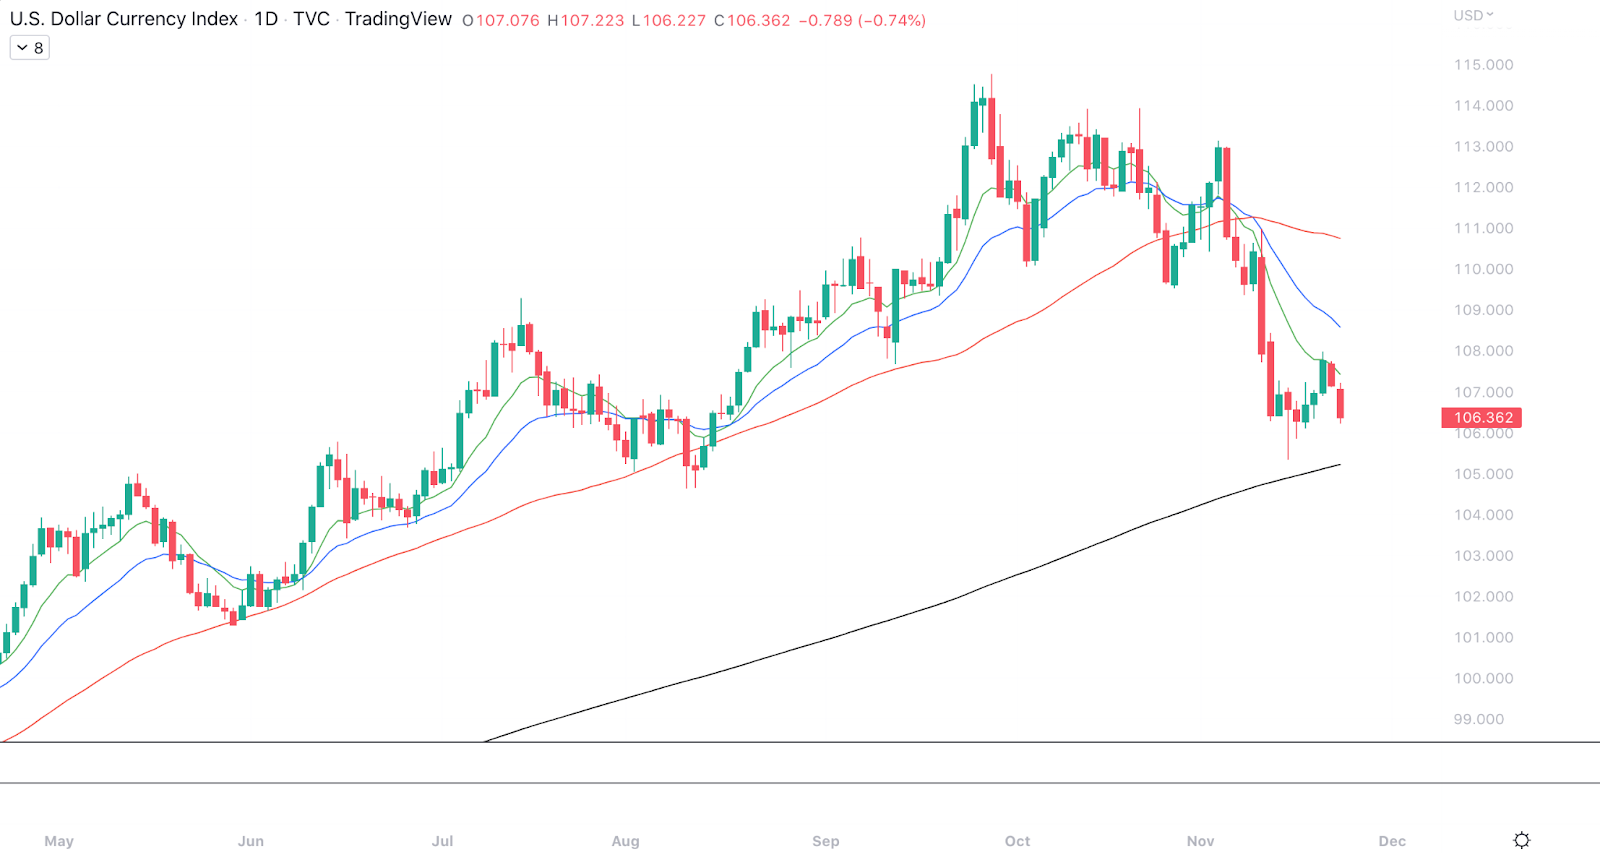
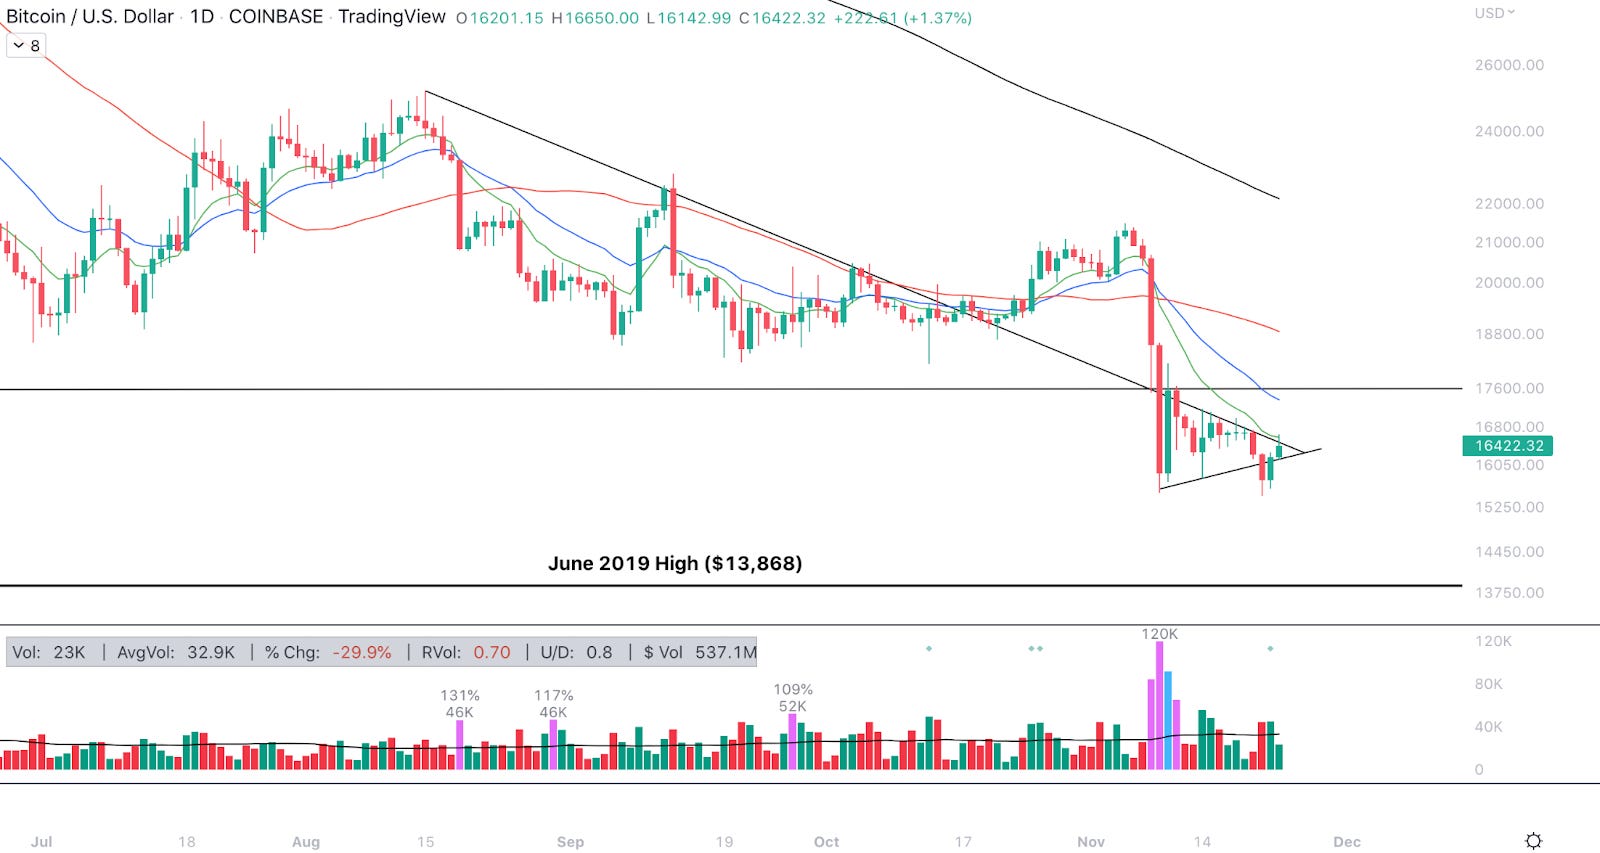
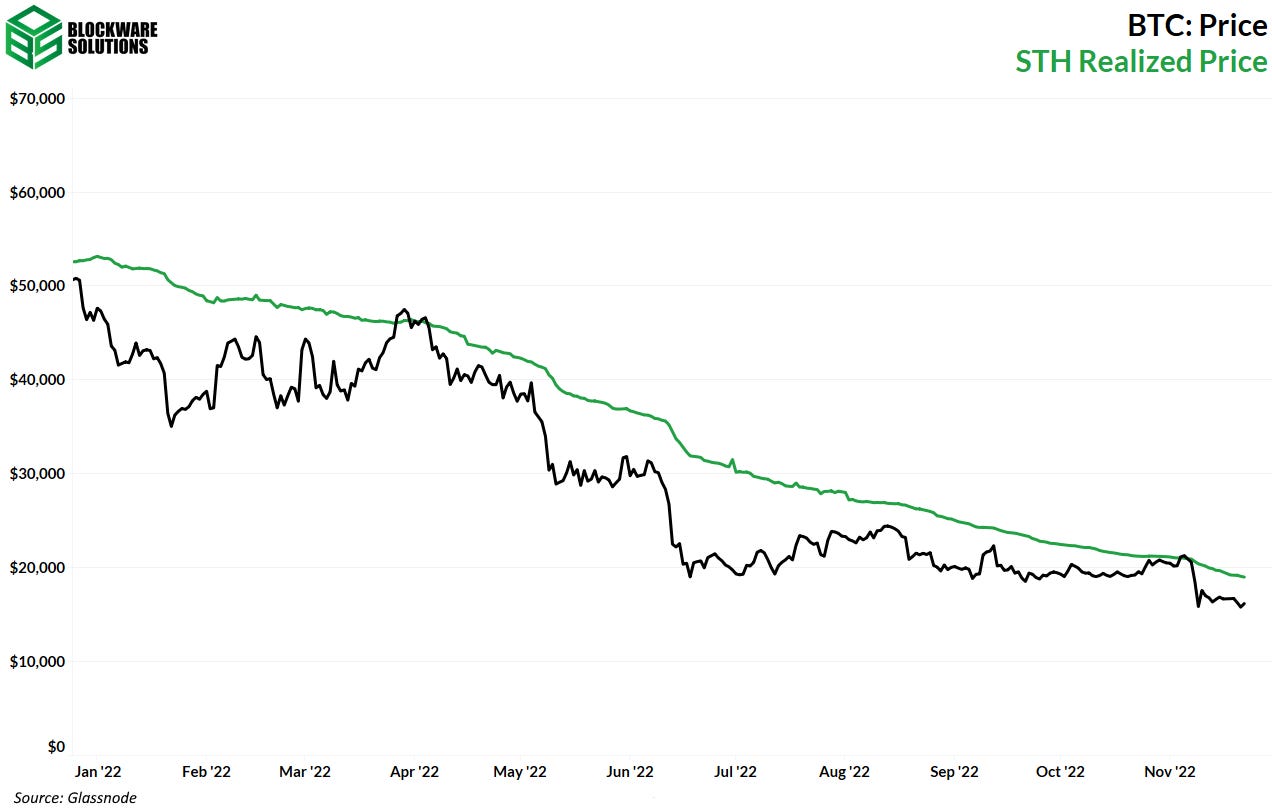
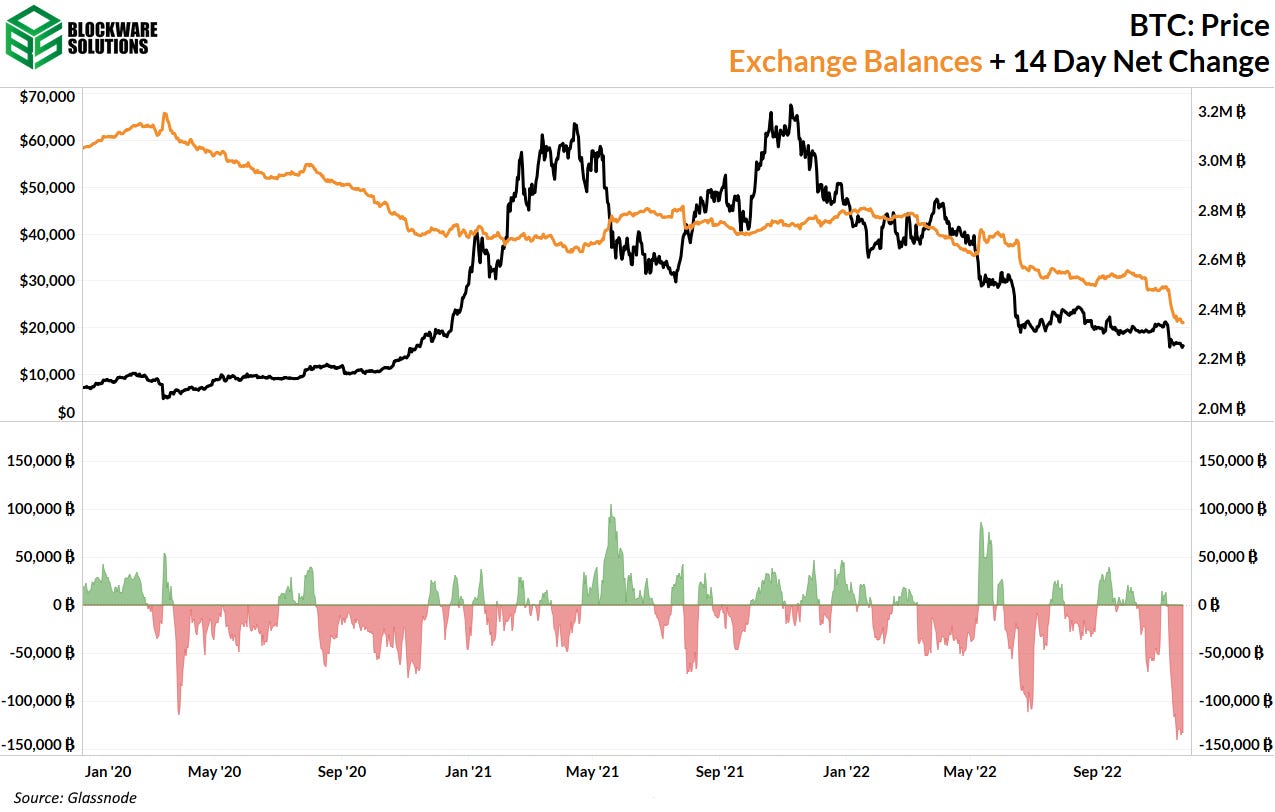
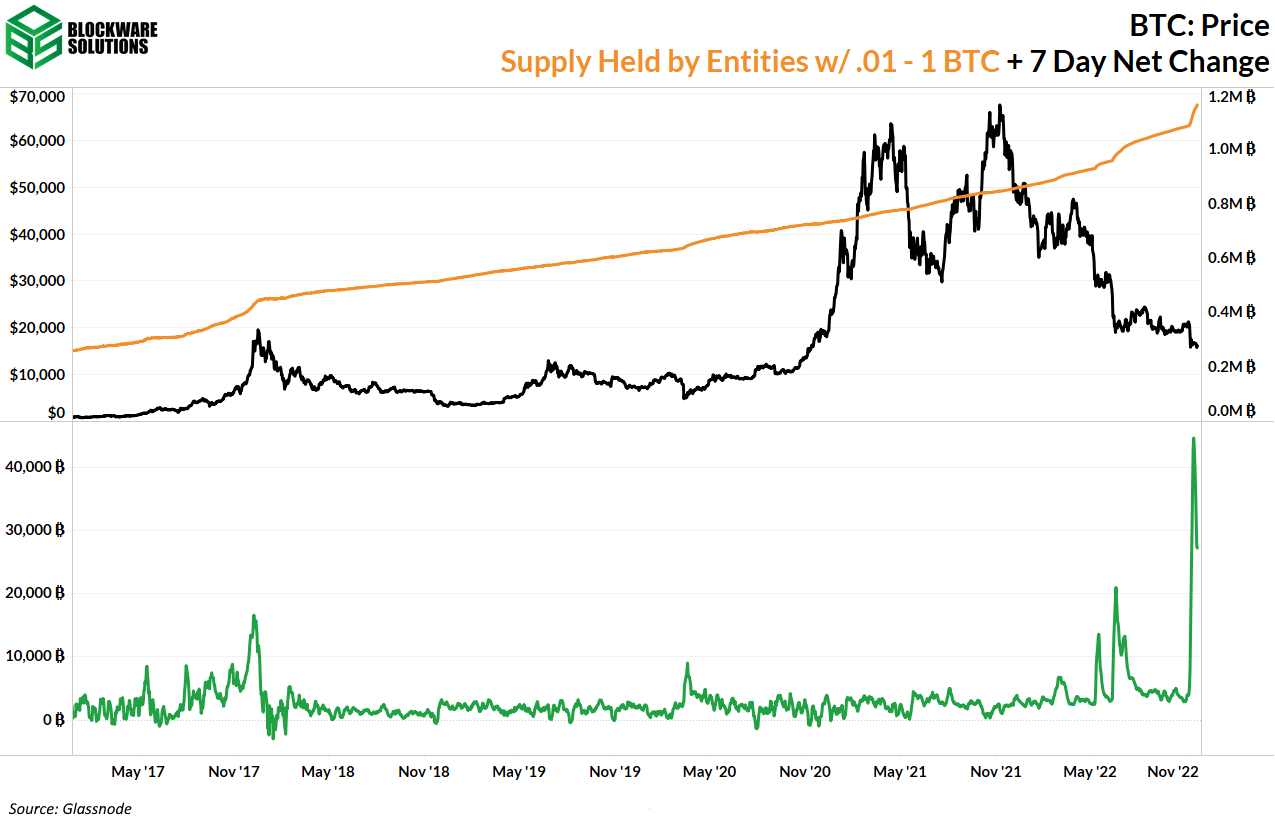
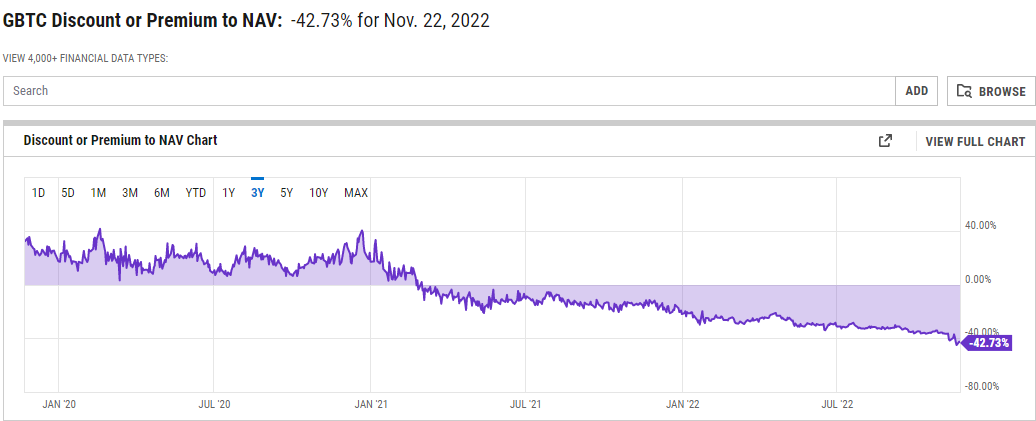
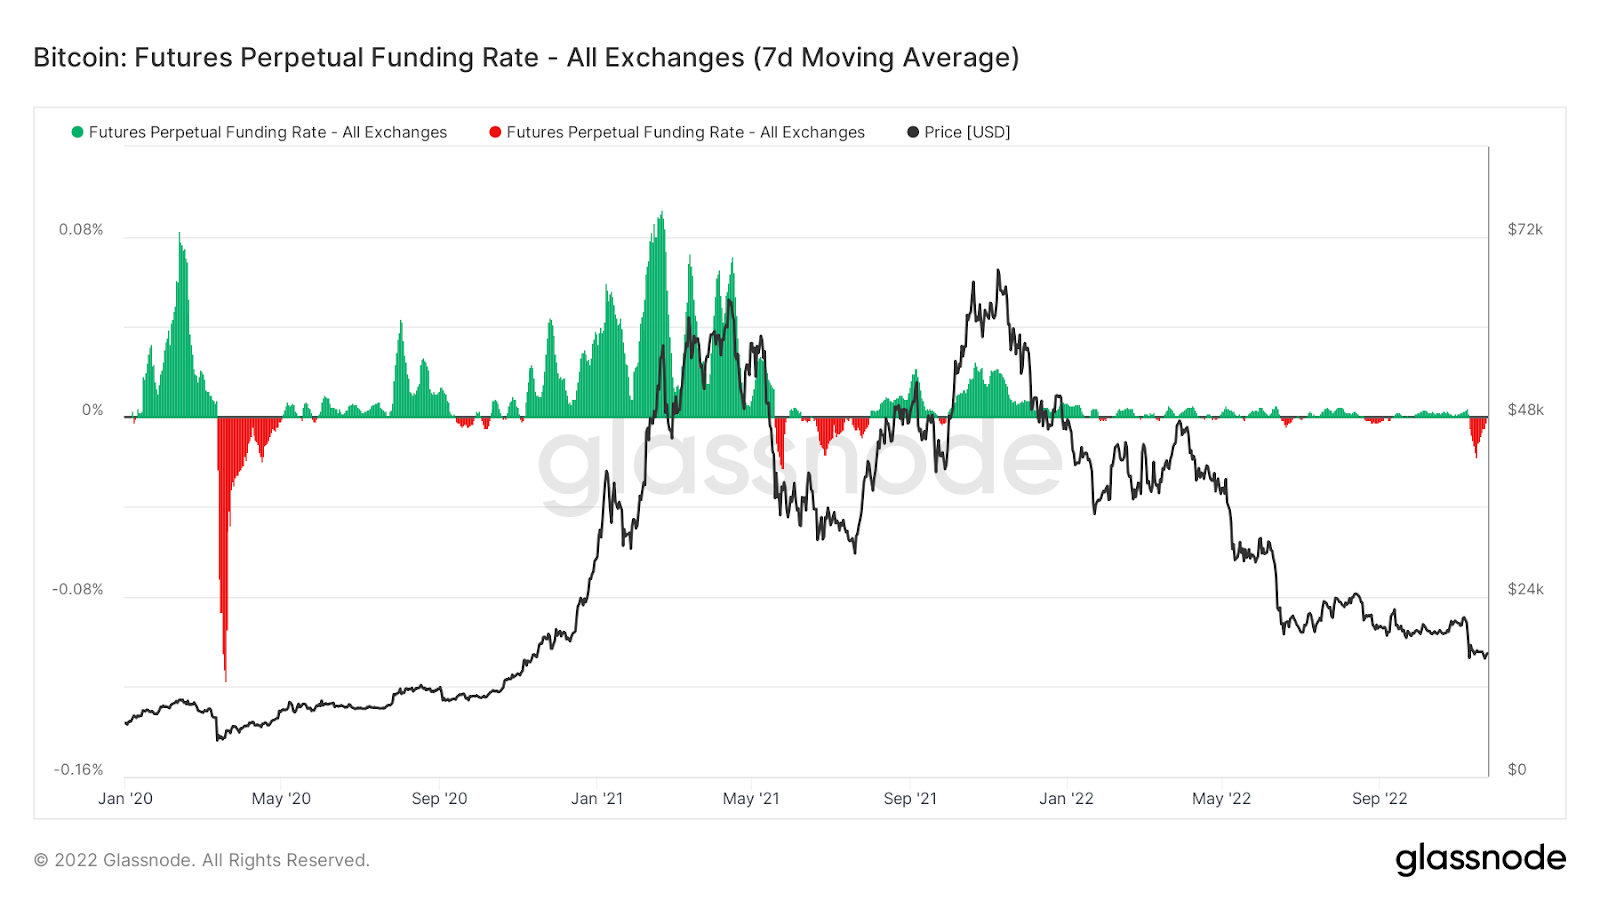
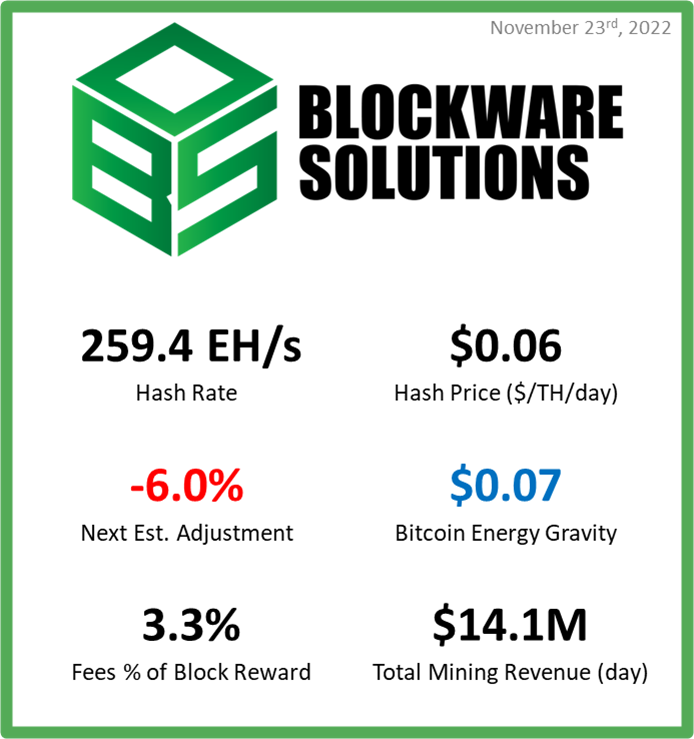
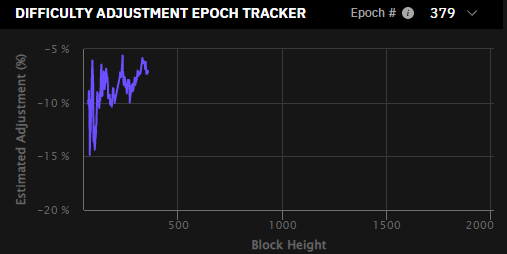
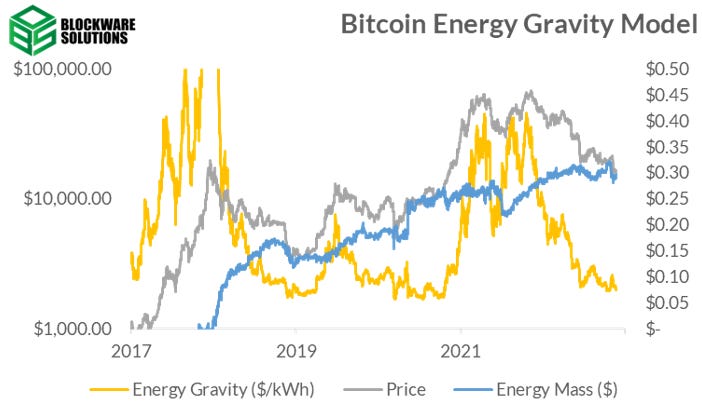
General Market Update Unsurprisingly, it’s been a quieter week as the market will be closed on Thursday in observance of the Thanksgiving holiday in the US. Markets will also have a half day on Friday, closing at 1PM EST. That being said, it has been an interesting week of price action, with the major indexes finding buyers at their 10-day EMAs. S&P 500 Index 1D (Tradingview) The 10-day, shown above in green, became support for the S&P late last week. This was a good indication that buyers are fairly strong at the moment. That being said, the S&P is heading towards its 200-day SMA, which is currently sitting overhead at $4,059.70. The 200-day is a key institutional tool that will likely cause some sort of strong reaction when/if price reaches it. As you can see above, during the last major rally for the S&P in June-August, the 200-day became resistance, and began the next leg down when price couldn’t break above it. While we can’t say for certain what will happen this time, investors should be vigilant around these levels. Furthermore, price is a bit extended from its longer term moving averages at the moment, meaning that it becomes easier for sellers to steal back momentum. US 2Y Treasury Yield 1D (Tradingview) Furthermore, we’ve seen a weaker week for Treasuries, with shorter maturity notes showing some strength in yield action. Above you can see that the 2-year yield is currently sitting at its 21-day EMA after holding 4.3% last week. This could provide a good area for yields to head back higher. While the longer maturity Treasuries do appear much stronger, the difference in strength between different maturity securities should be noted. Due to the fact that shorter maturity bond prices look weaker, it’s a strong signal that investors remain concerned about shorter-term economic conditions. At the moment, the 2-year peaked on November 7th at 4.88% yield, meaning that the market is currently expecting to see the Fed Funds Rate peak in the ~5% range. DXY 1D (Tradingview) Wednesday we’re seeing a continuation of the recent weakness from the US Dollar Index (DXY). This is likely the biggest contributing factor to the recent price action we’ve seen from US equities. If you compare the DXY chart above to the S&P chart discussed previously, you’ll notice that the price structure is essentially inverted. As we’ve discussed in this newsletter numerous times, a strong dollar tends to be bad for US companies, as your exports become more expensive to foreign buyers. Now, as we see the dollar weaken, it’s helped foster the recent bounce we’ve seen in equities. Heading into next week, watching the 2Y and DXY will likely give us the strongest indication of what to expect from equities in the short-term. Crypto-Exposed Equities At the time of writing, we’re seeing a slight bounce from the crypto-related industry group on Wednesday. That being said, this is one small green day after several red days. While the trend is still primarily down, it’s unsurprising that crypto-equities would bounce alongside BTC. As we’ll discuss below, BTC and its related stocks are far from out of the water. At the moment, there are a couple stocks who appear a bit stronger than the rest from a technical perspective this week. Those stocks would be: DGHI, BRPHF, and MSTR. But with BTC shaping up the way it is, buyers should certainly be vigilant here. Bitcoin Technical Analysis Following the break below the lower limit of a symmetrical wedge, BTC has (so far) rebounded on Tuesday and Wednesday. BTCUSD 1D (Tradingview) That being said, BTC appears to have run into a bit of resistance on Wednesday morning at a key level in the short-term. The multi-month downward trendline, shown above in black running from August through today, has now become resistance numerous times. This week has been no different, with this line creating the upper edge of the recent wedge. This line also coincides with BTC’s 10-day EMA at the moment, making it the perfect spot for sellers to step in, as they did today (so far). At the moment, this is the major spot to watch in order to understand current price action. A clean break above this level could push BTC on a move back higher. A break back below the current lows at $15,460 would likely result in a retest of the 2019 highs at $13.9k. Bitcoin On-chain and Derivatives The realized price (cost basis) of short term holders is now down to $19,000. As discussed in previous newsletters, the realized price of short term holders represents the first level of resistance to signal the end of the bear market. This is a psychological barrier as short term holders may be tempted to exit the market at their cost basis price in order to break even in fiat terms. At the time of writing, price currently sits at ~$16.4k and I expect that it will test this resistance level sometime in the next 2-3 weeks. Exchange balances have plummeted the last two weeks. This is a record level of declining exchange balances. This is an incredibly exciting and optimistic trend to see. Mass self-custody is a prerequisite for major price appreciation in BTC. Moreover, as more BTC leaves exchanges, on-chain data becomes more useful. The Bitcoin blockchain, and thus on-chain data, exists apart from any systems including exchanges. As self-custody of BTC becomes increasingly common, we will have more assurance that realized price serves as an accurate measurement of cost basis. The insane level of accumulation by entities with .01 – 1 BTC has cooled off slightly this week relative to last but overall the “plebs” are still stacking Bitcoin at a never-before-seen pace. Retail moving sats to cold storage is the embodiment of the Bitcoin ethos. The Grayscale Bitcoin ETF (GBTC) is now trading at a -42% discount to the real BTC. In the long run, GBT will likely trend to zero as it is becoming increasingly difficult to justify holding this asset as it exposes you to extreme counterparty risk that is not present when holding BTC in cold storage. Speaking of counterparty risk, Digital Currency Group, which holds 10% of the supply of GBTC, owes $575 million to Genesis Global Capital. Genesis, who recently paused customer withdrawals (always a bad sign), has been in the middle of the crypto lending web as it had exposure to both Three Arrows Capital and FTX. The funding rate for non-expiring (perpetual) futures contracts has reached its largest negative level since the summer of 2021. As a reminder, the funding rate does not mean more short positions than long positions. Rather, it indicates that short positions are periodically paying long positions in order to incentivize traders to go long. Ironically, I view extreme levels of trading bearishness as bullish. Note the extreme negative funding rate at the March 2020 bottom and the bottom of last summer’s mini-bear market; then observe the price action that followed. Just as the tops of markets have a sentiment that price is going to go up forever, the bottom is going to have the sentiment that price is going down forever. Bitcoin Mining Next Estimated Difficulty Adjustment In the above mining metric graphic, every week we include the next estimated mining difficulty adjustment, but how is this estimated? Bitcoin difficulty adjusts every 2016 blocks (~ 2 weeks) based on how much hashrate is on the network, but the Bitcoin network itself has no idea how much hashrate exactly exists. Bitcoin nodes can only see how fast blocks have been mined using their each unique internal clock. If blocks are mined roughly every 10 minutes, this means new supply is on schedule and difficulty will remain the same. If blocks are mined every ~ 9 minutes and 30 seconds, this means new supply is being mined faster than expected, hashrate has likely joined the network since the previous difficulty epoch, and difficulty will adjust down. If blocks are mined every 10 minutes and 30 seconds, hashrate has likely left the network, and difficulty will adjust down. The Difficulty Adjustment Epoch Tracker from Braiins attempts to show what the next adjustment will be based on how fast (or slow) blocks have been coming in since the difficulty epoch started. So far, blocks have been coming in slower than expected. The average block time is 10 minutes and 49 seconds. This is why the next projected difficulty adjustment is down. As more blocks come in, we get a more statistically significant estimate of how much hashrate is on the network. Early into each epoch, the estimate can be ascribed more to luck and random chance due to the low sample size. Energy Gravity Bitcoin Energy Gravity was a model and report published by Blockware Intelligence. It was an attempt to model the relationship between the price of Bitcoin and its cost of production using average rig efficiency over the previous two years and public commercial US electricity prices. The thesis is simple. Tops are marked by very high miner margins. High margins drive capital away from spot BTC and into mining. Bottoms are marked by miner capitulations. Low margins remove the weakest miners, reducing total mining day to day OpEX, and encouraging new capital to flow into spot BTC instead of mining. Today, and since this summer when Bitcoin traded into the $17,000s, Energy Gravity has been reaching near all-time lows, indicating that the past few months have been an opportune time to average into BTC and mining. All content is for informational purposes only. This Blockware Intelligence Newsletter is of general nature and does consider or address any individual circumstances and is not investment advice, nor should it be construed in any way as tax, accounting, legal, business, financial or regulatory advice. You should seek independent legal and financial advice, including advice as to tax consequences, before making any investment decision.
© 2022 William Clemente III |

