Blockware Intelligence Newsletter: Week 66
Blockware Intelligence Newsletter: Week 66Bitcoin on-chain analysis, mining analysis, macro analysis; overview of 11/25/22-12/02/22
Blockware Intelligence Sponsors If you are interested in sponsoring Blockware Intelligence email: sponsor@blockwaresolutions.com.
Summary
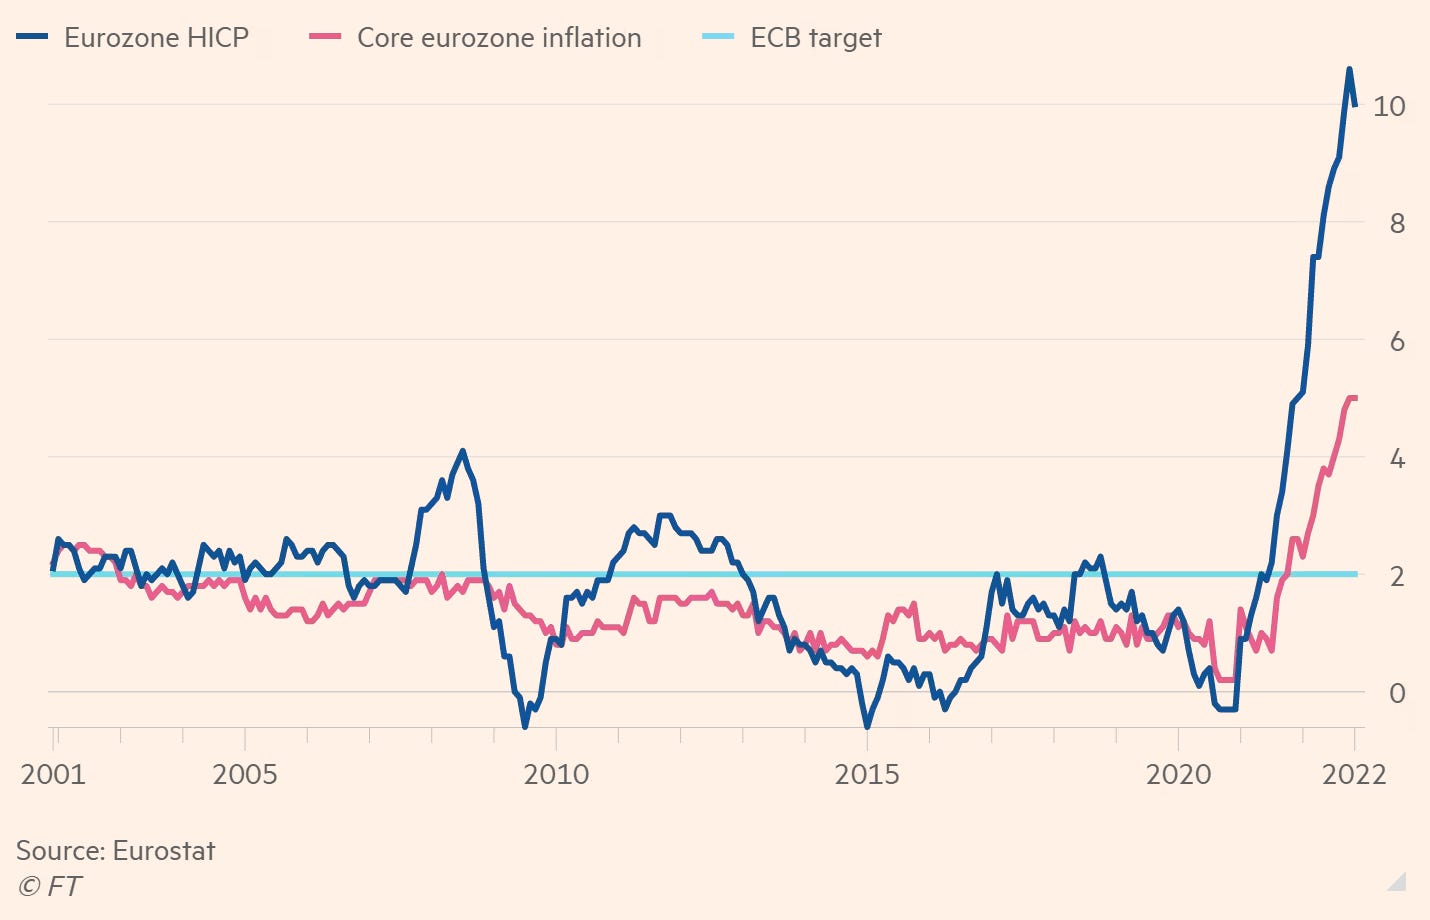
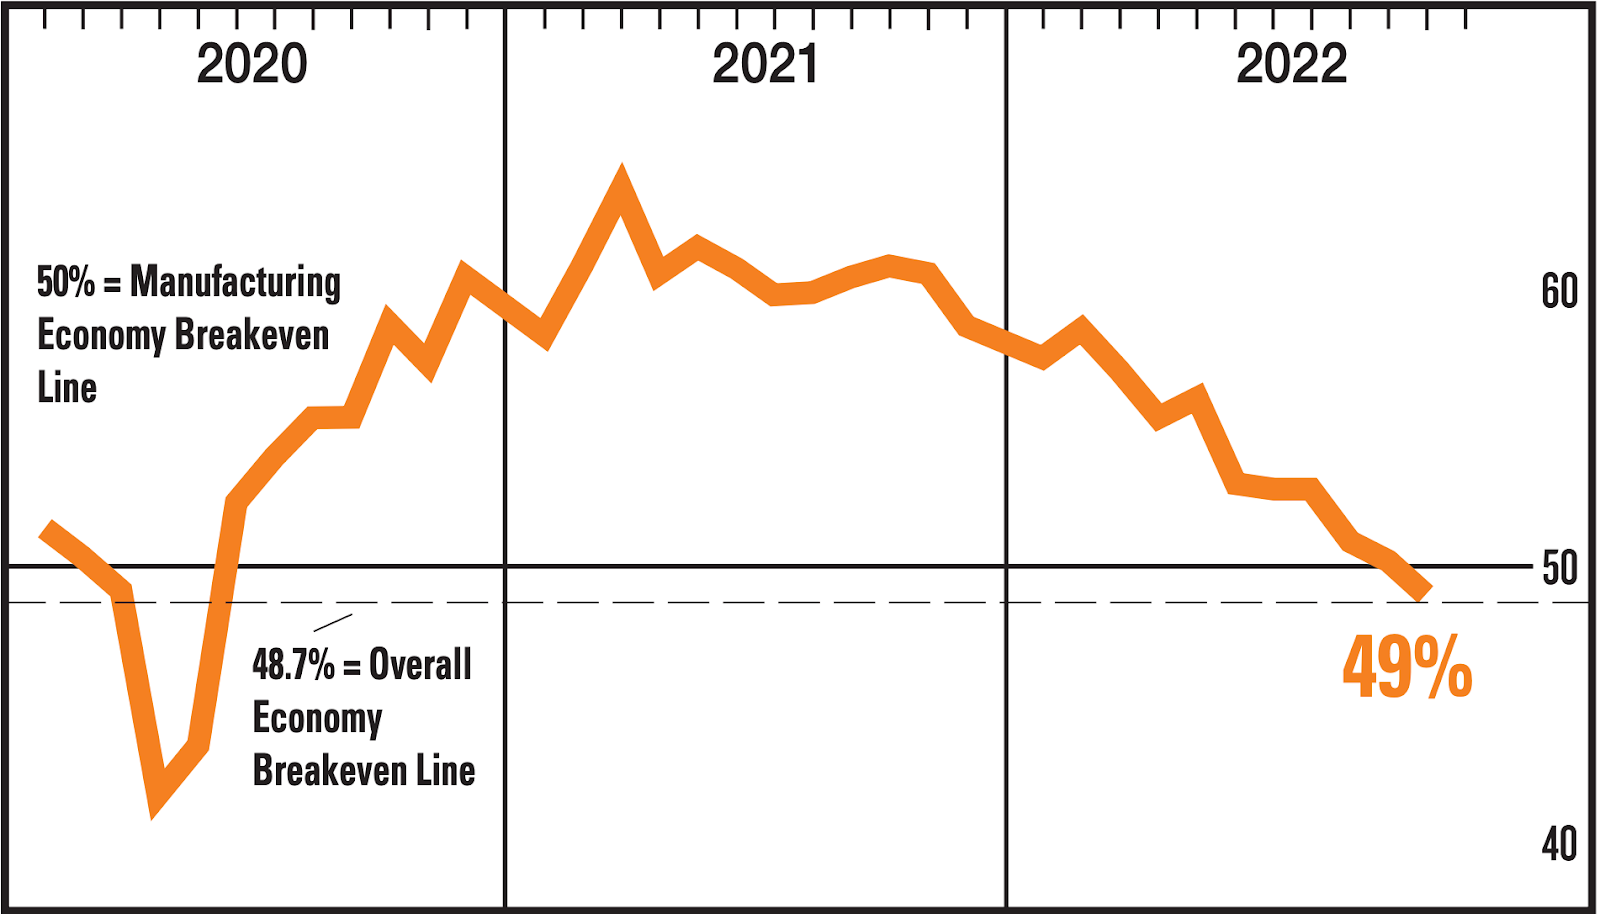
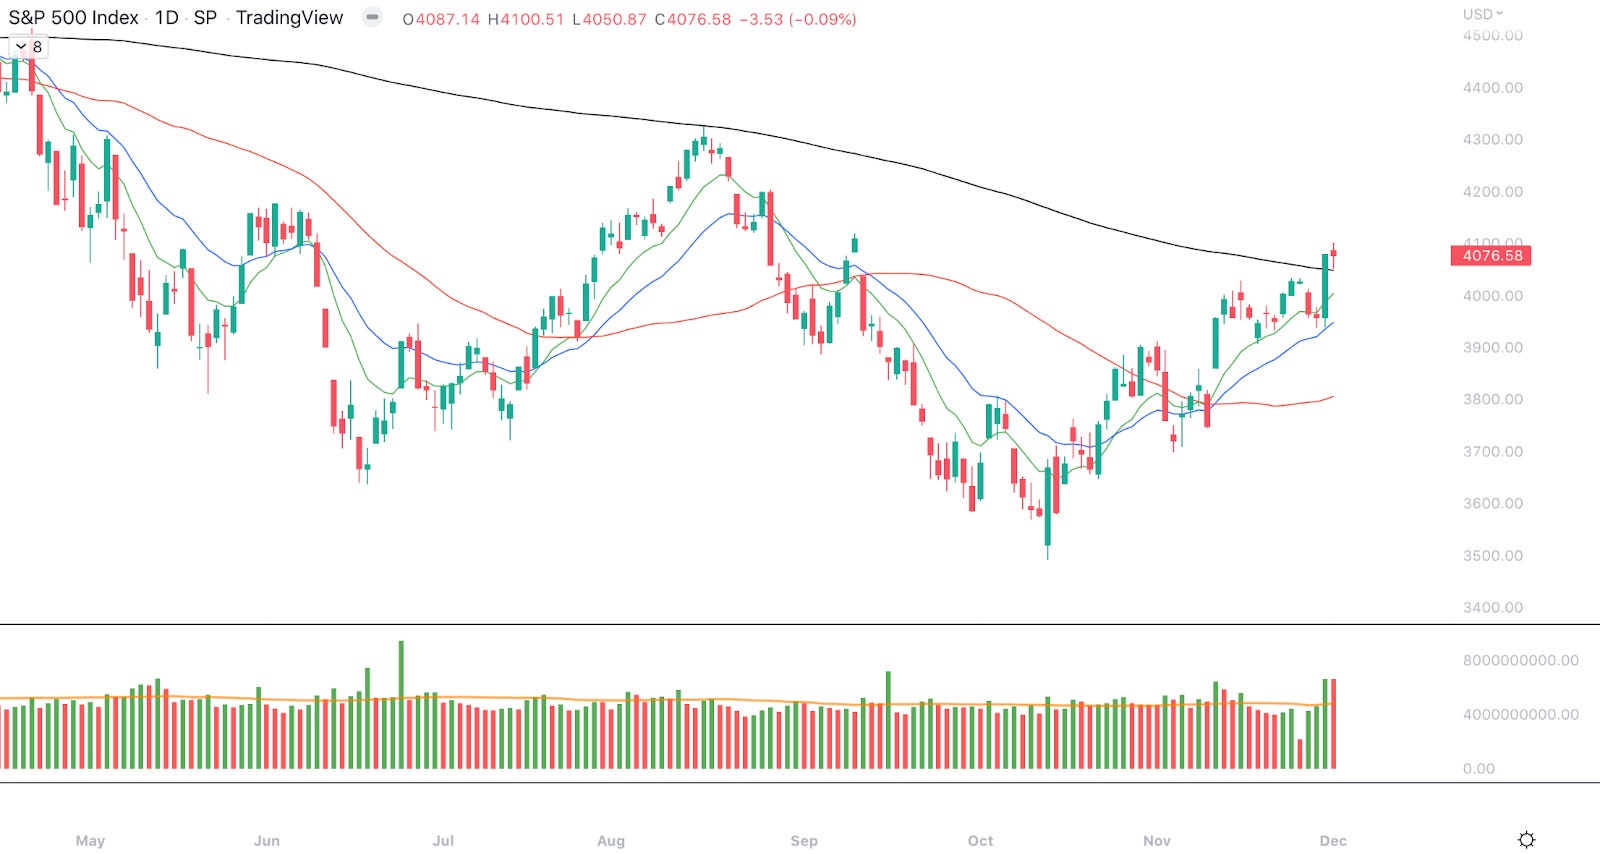
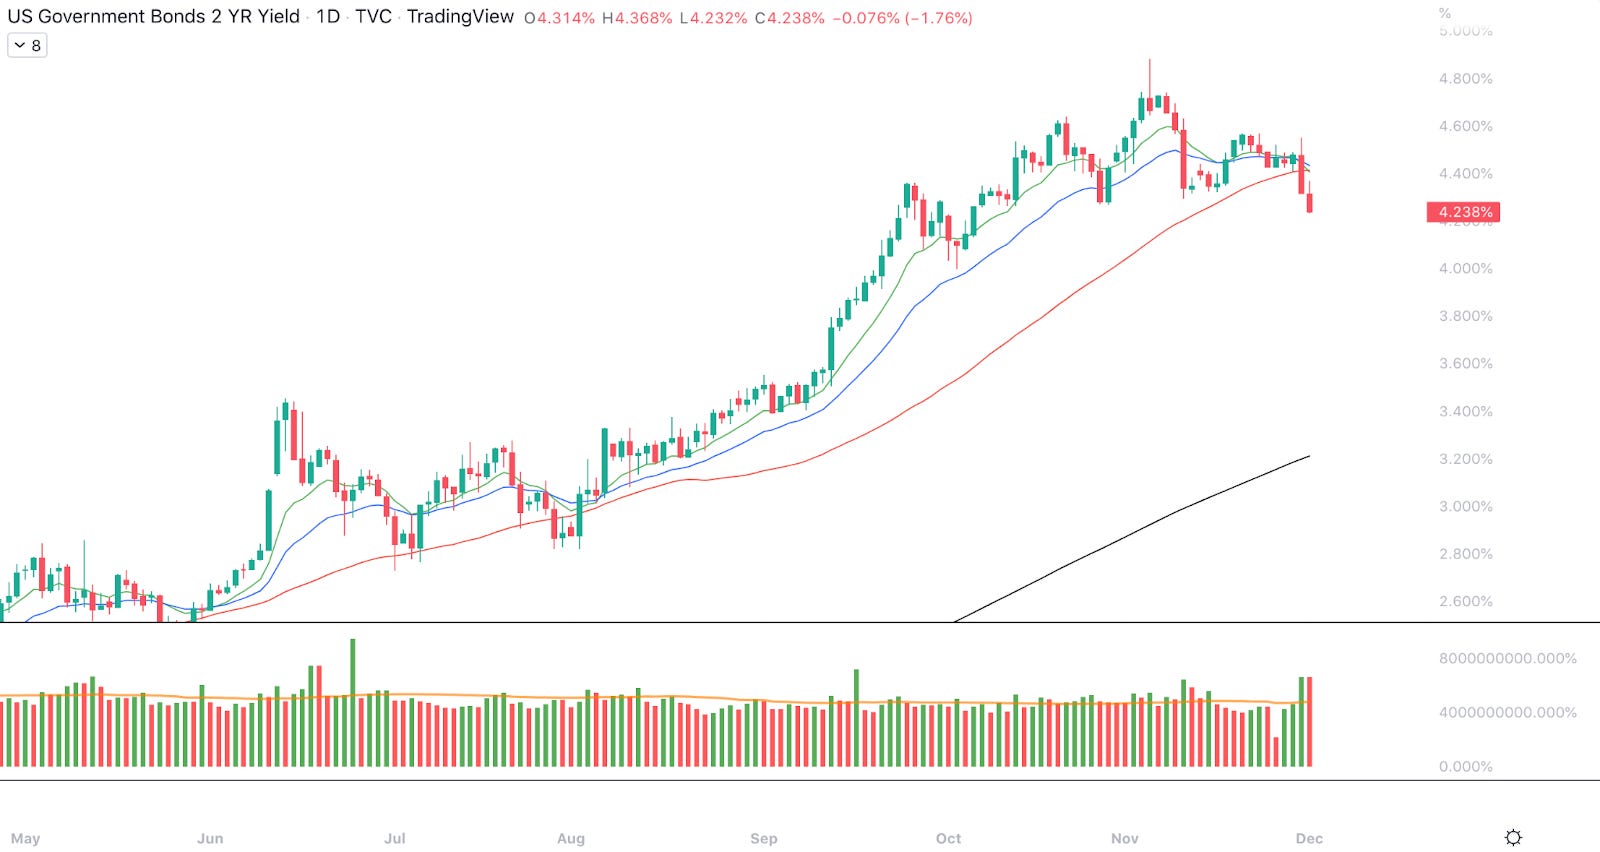
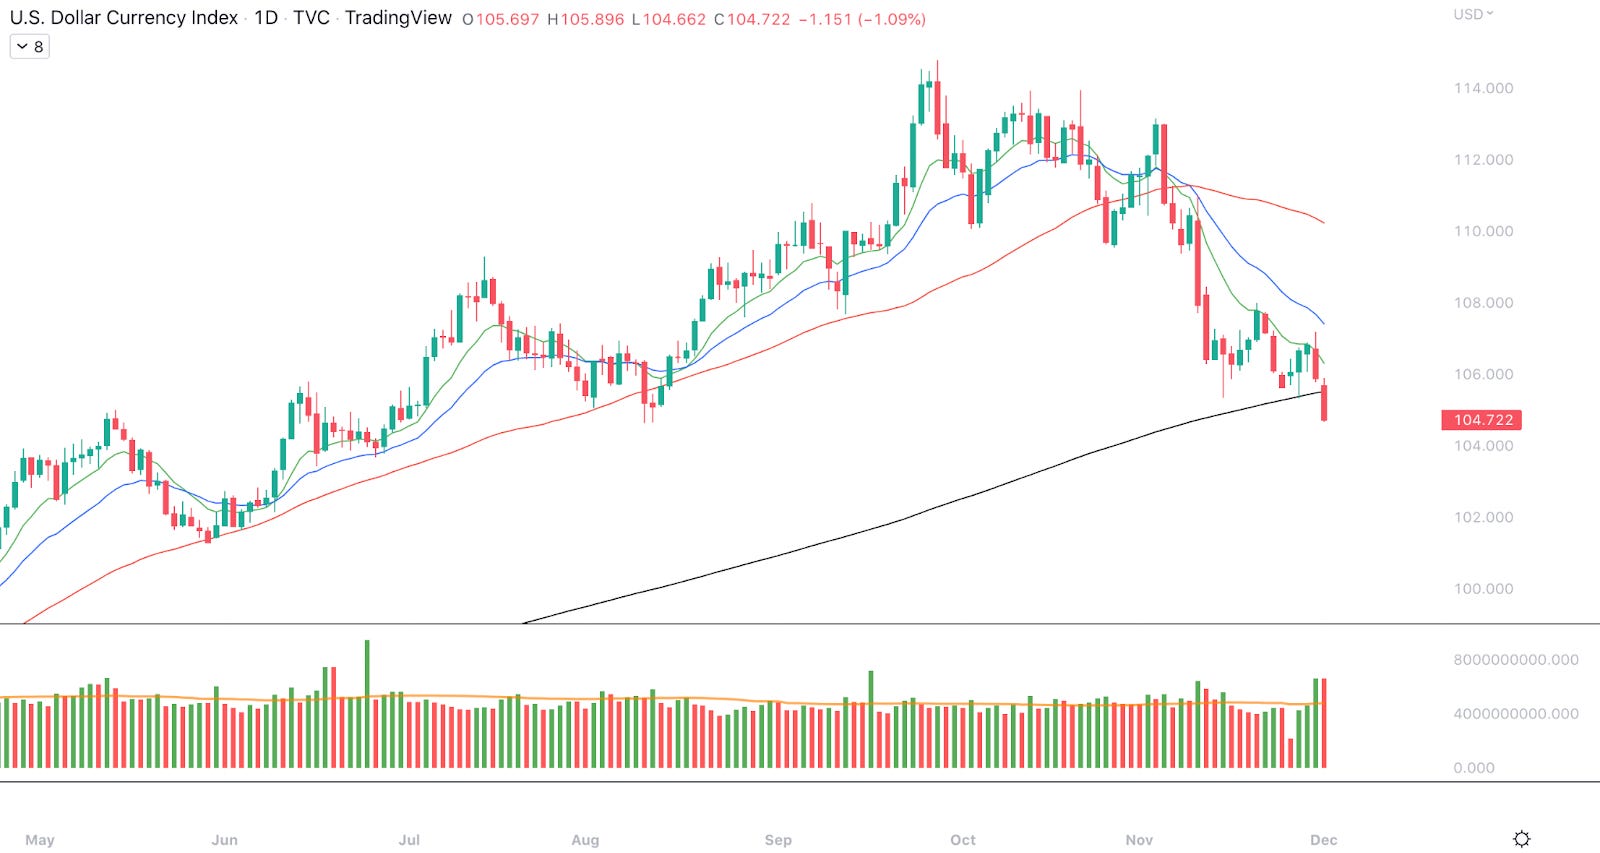
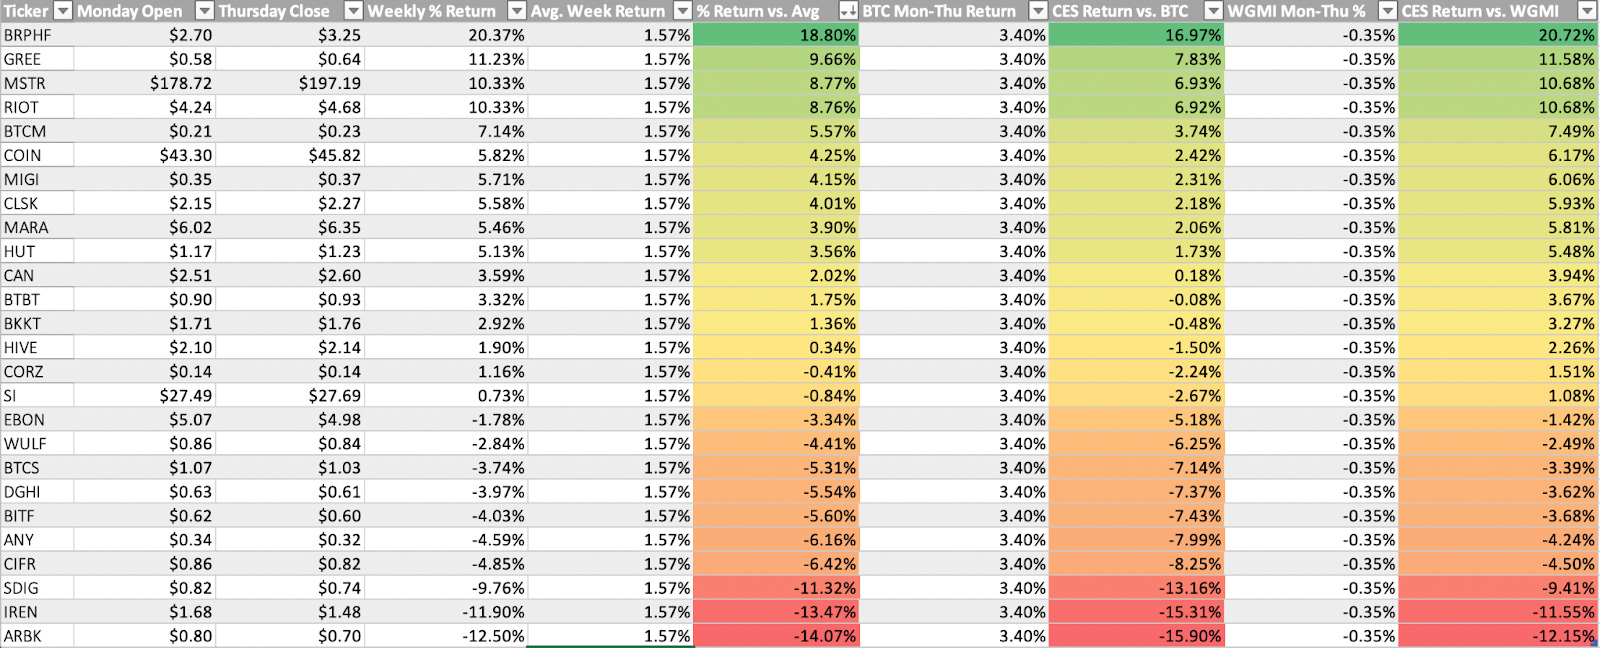
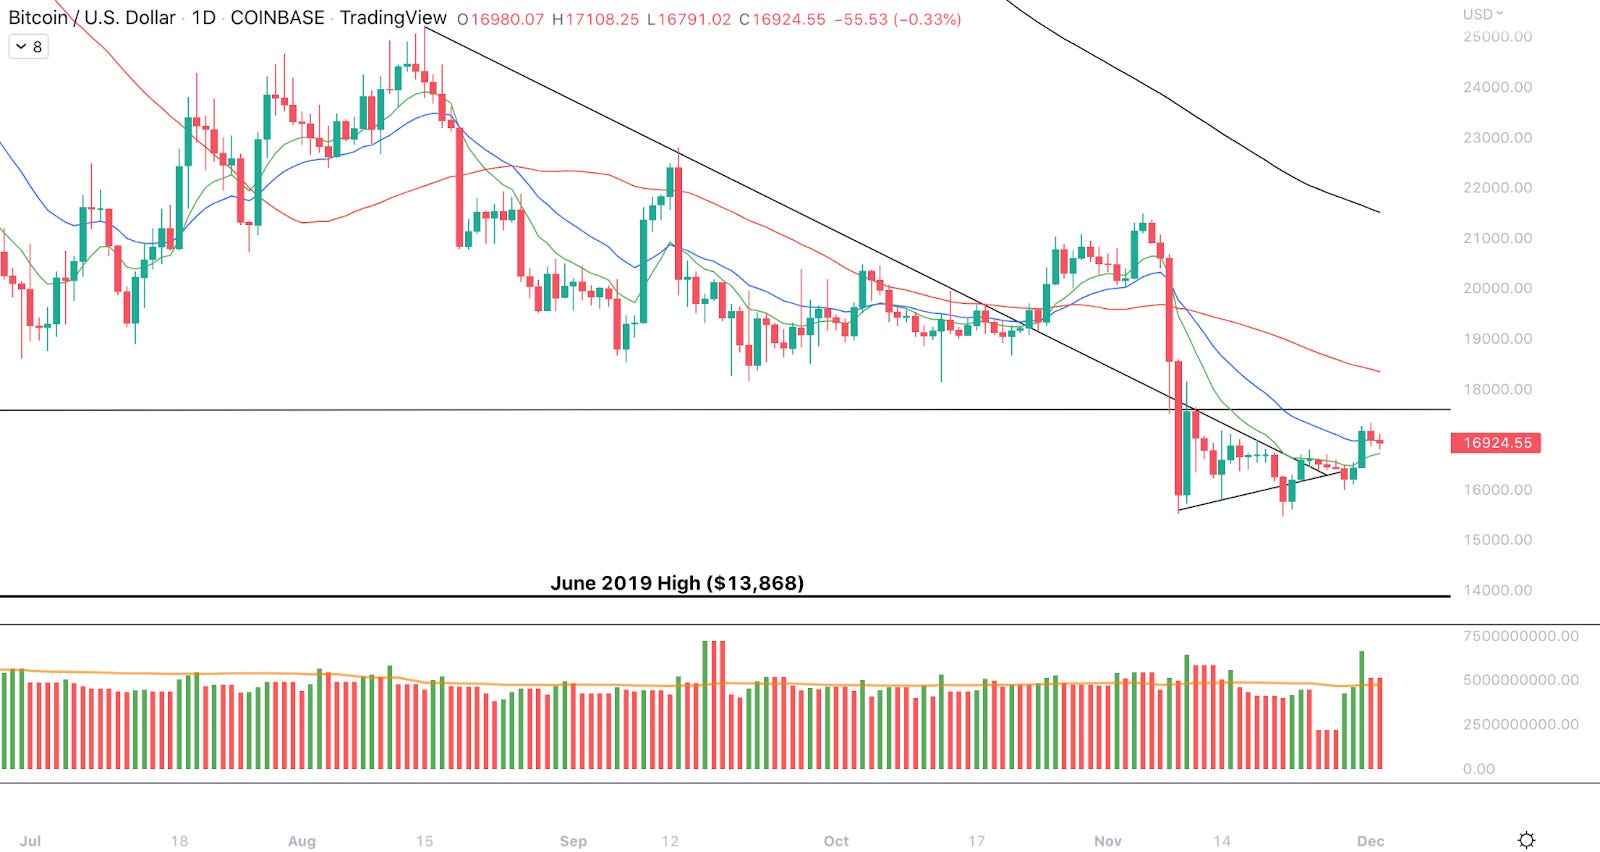
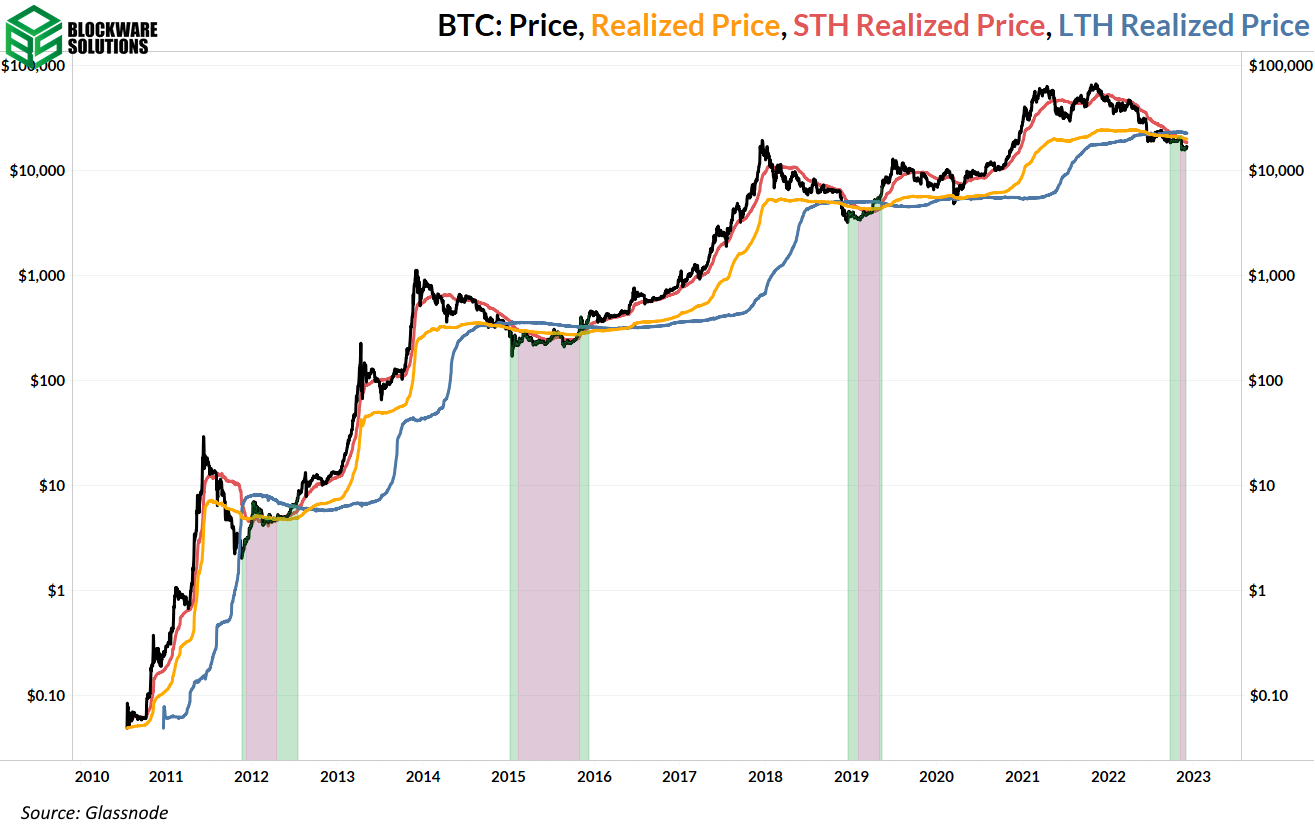
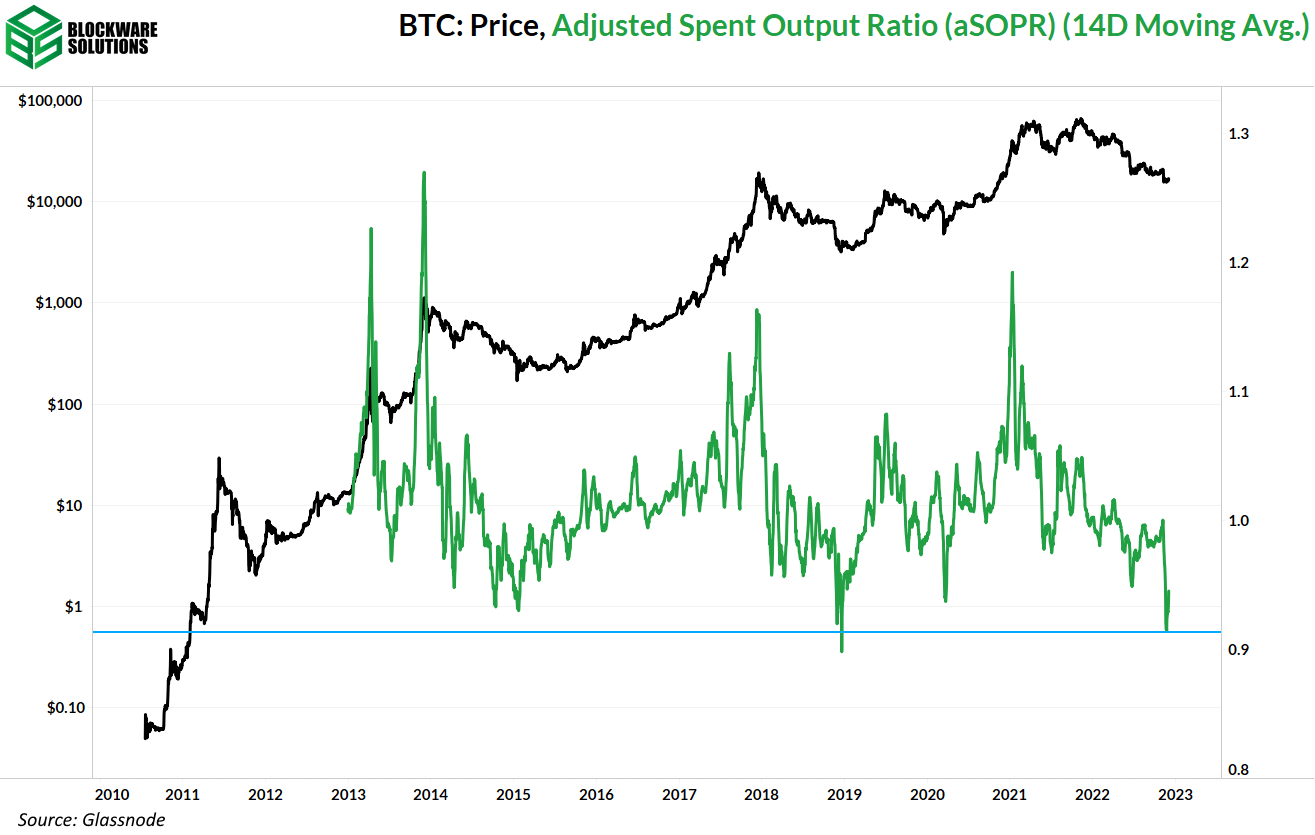
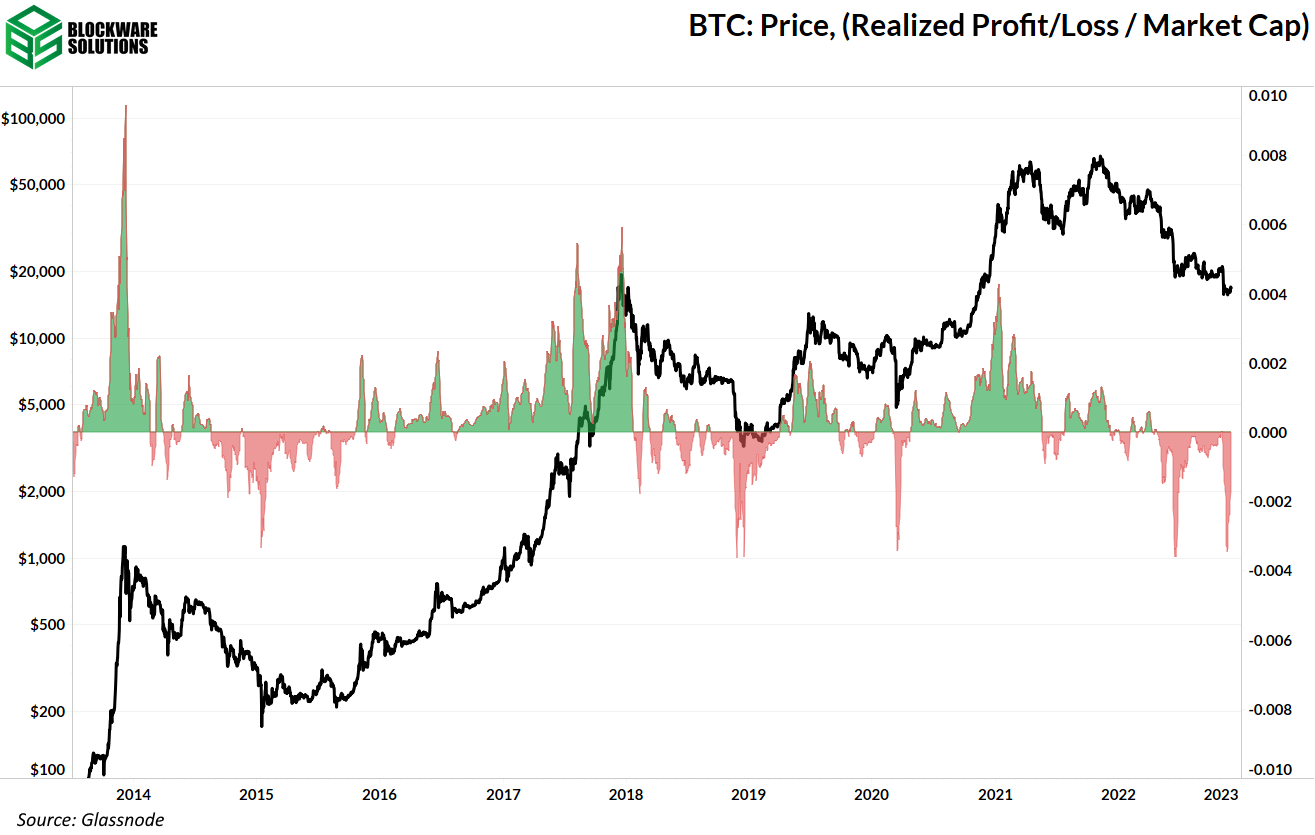
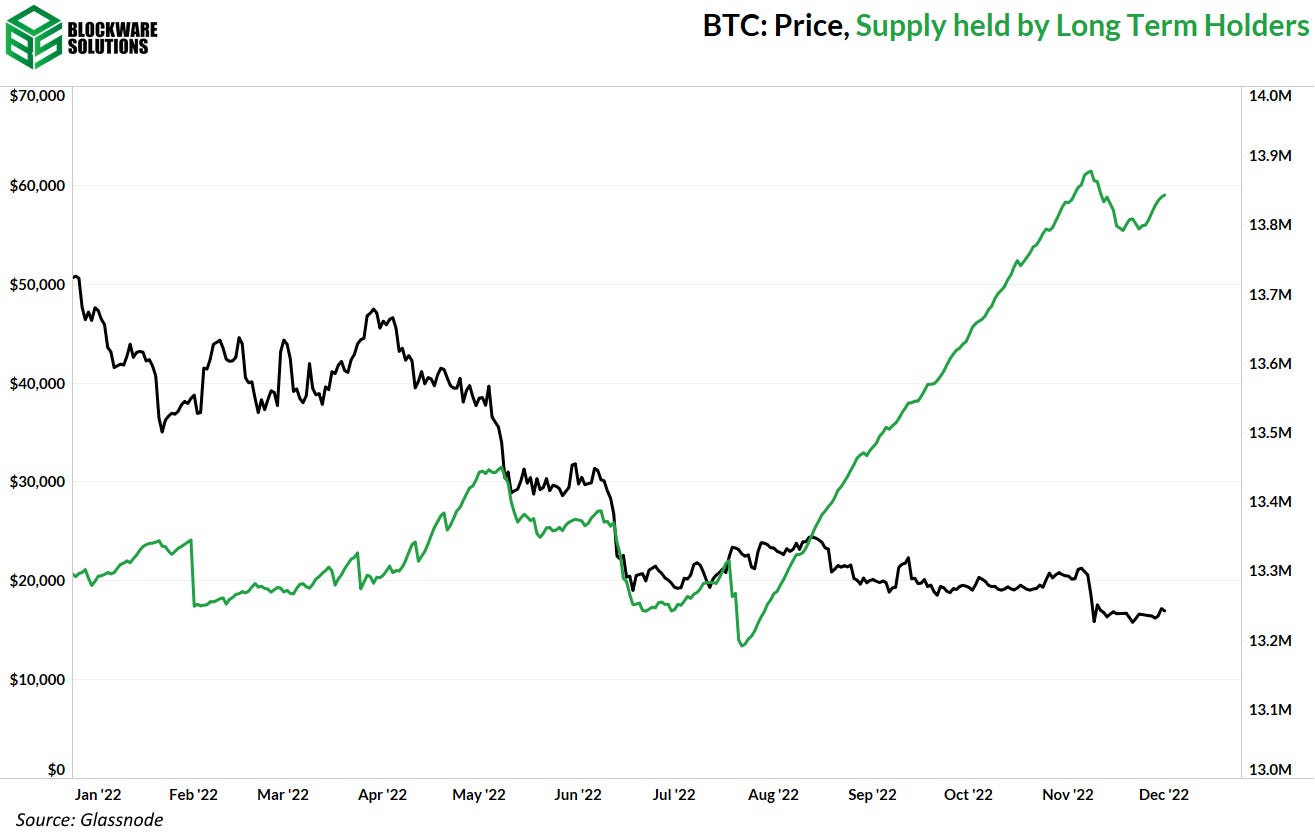
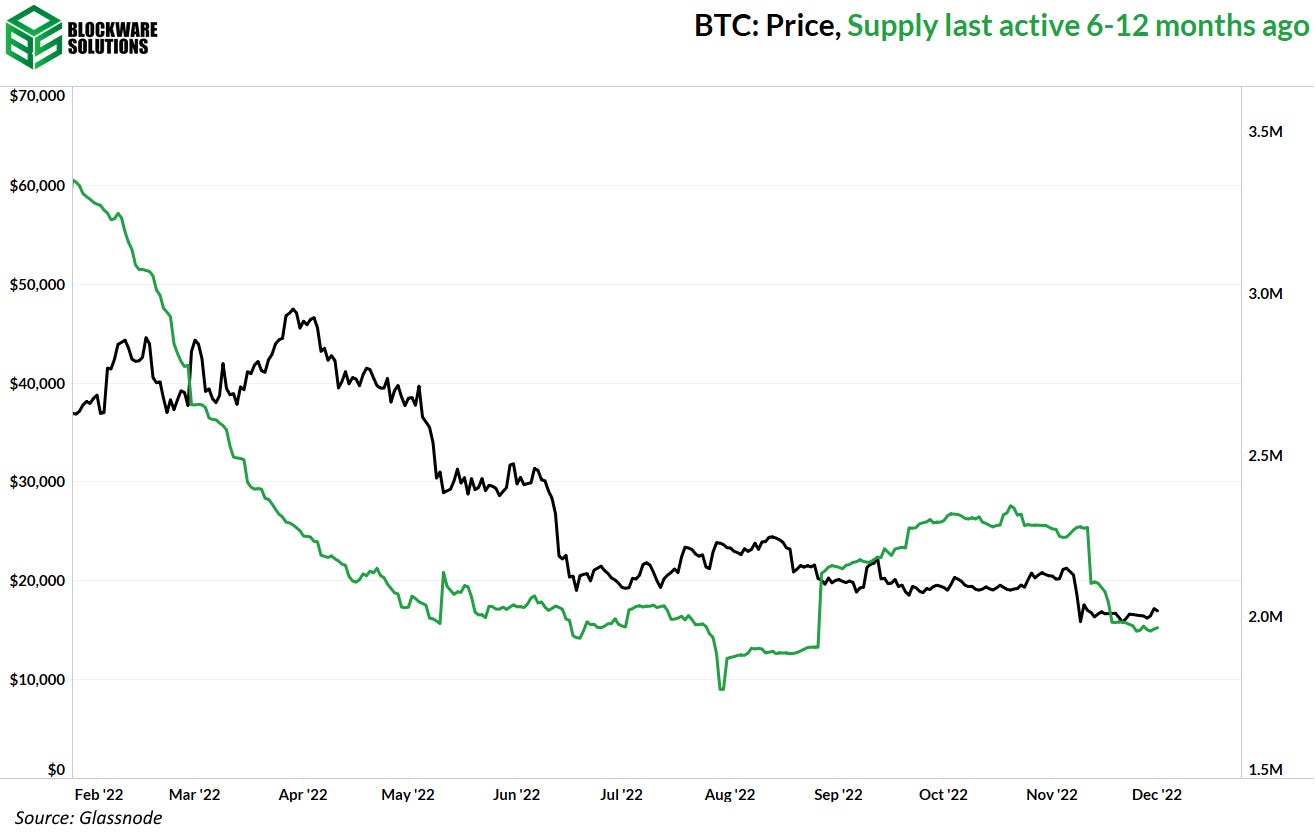
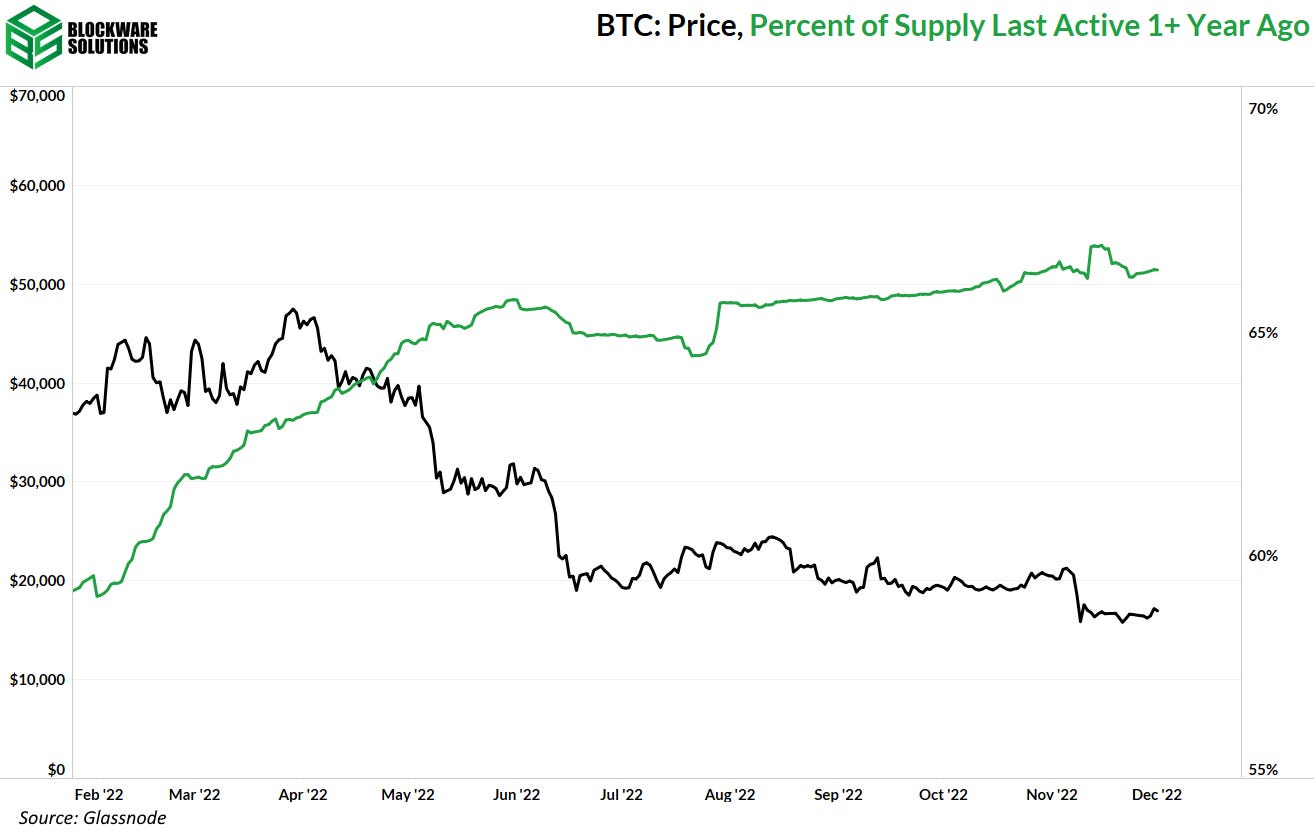
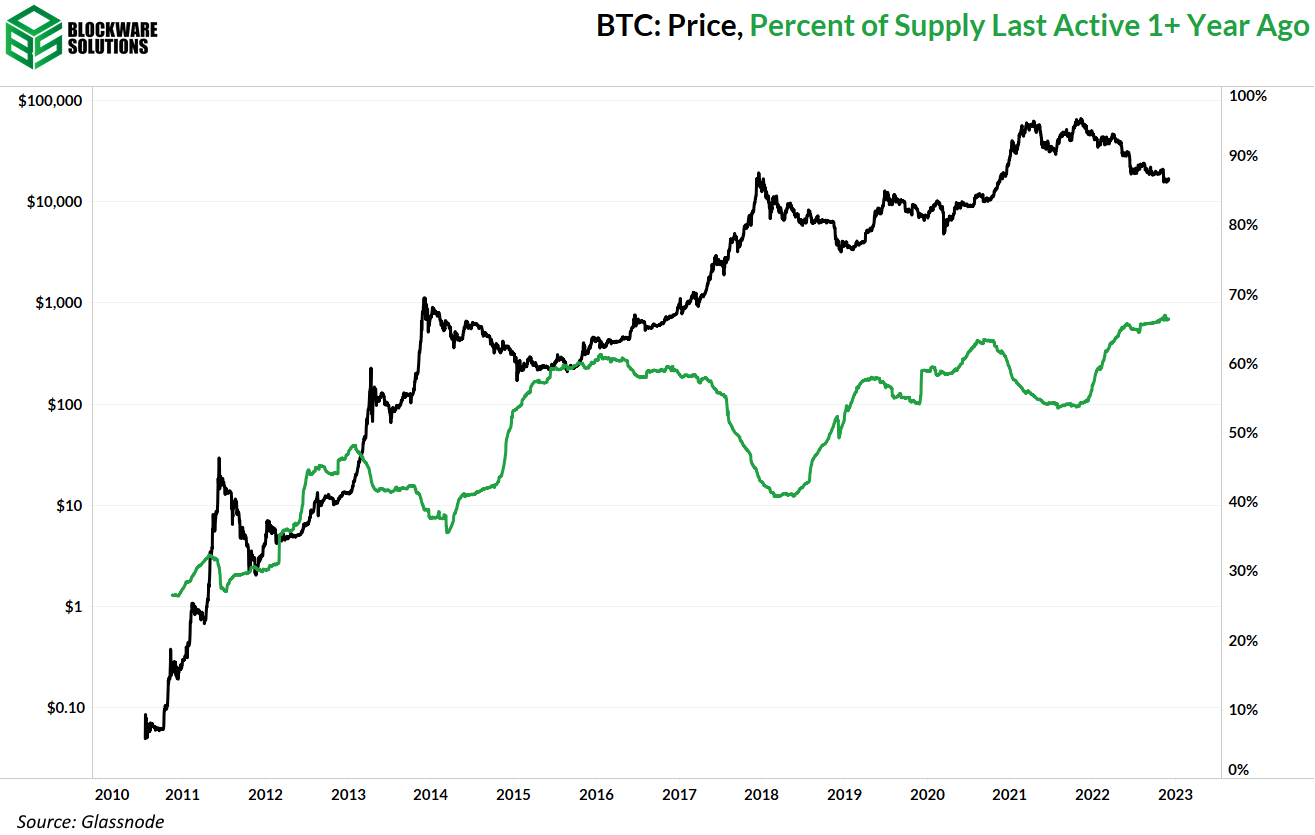
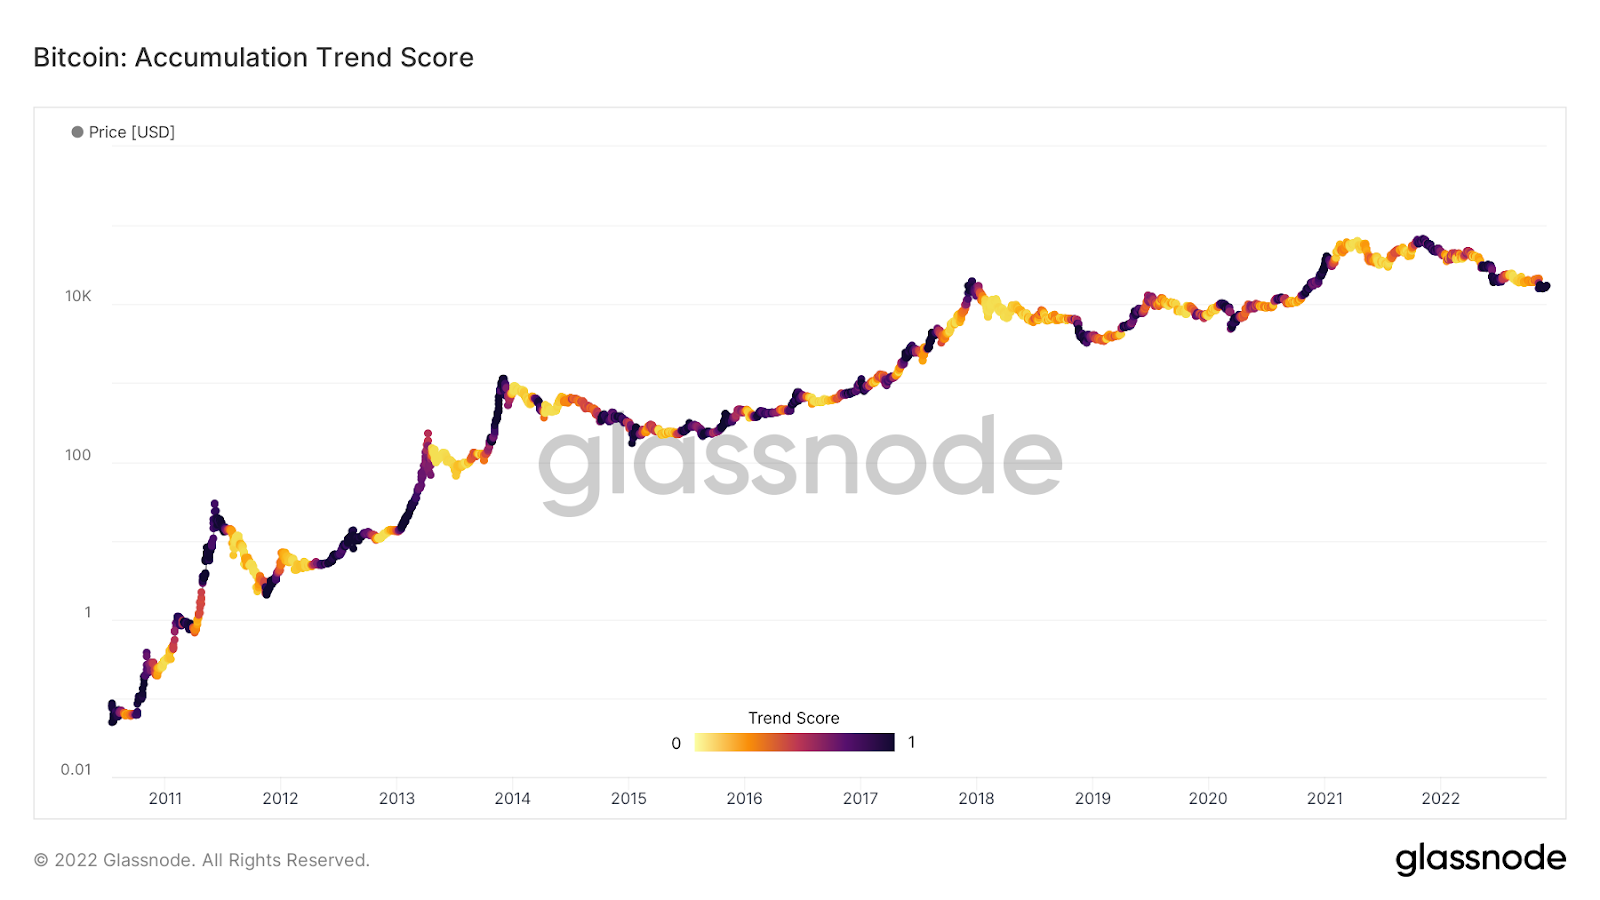
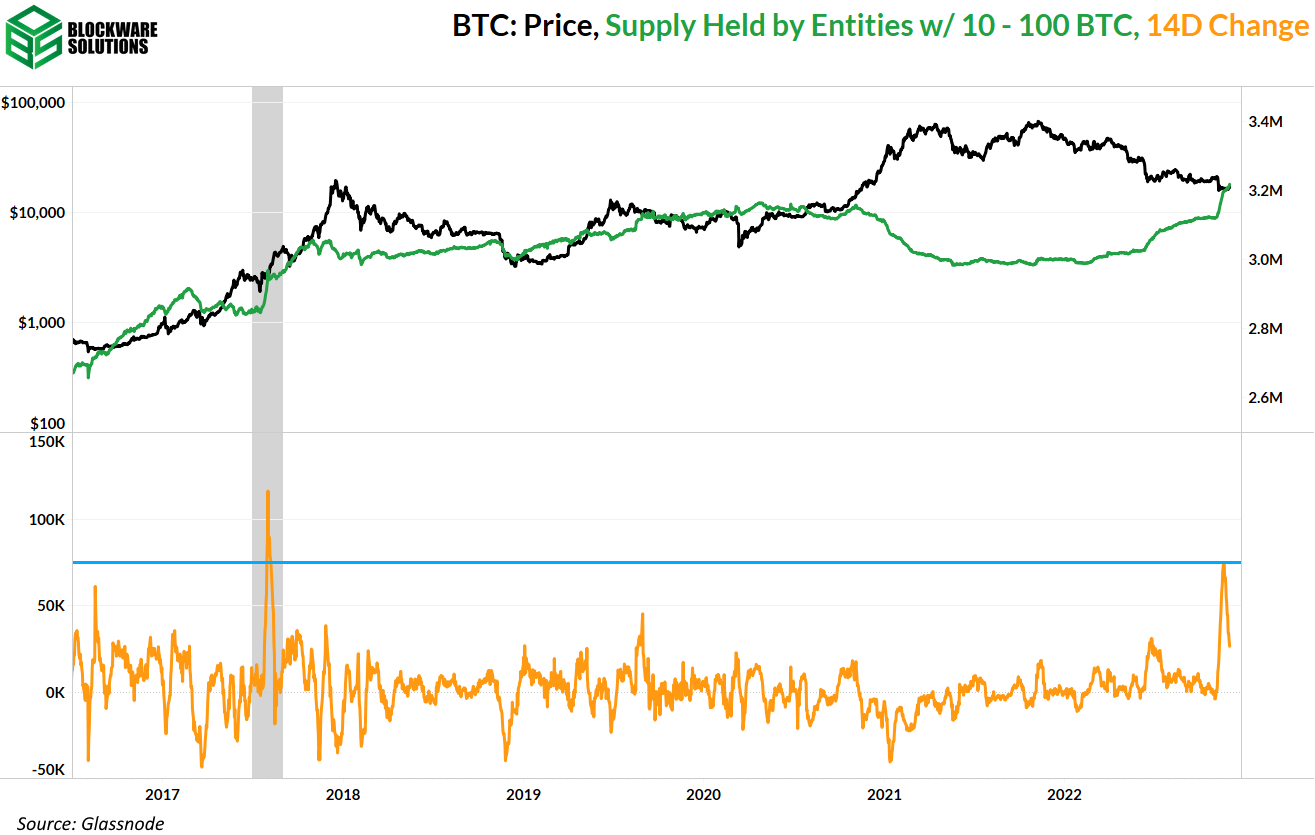
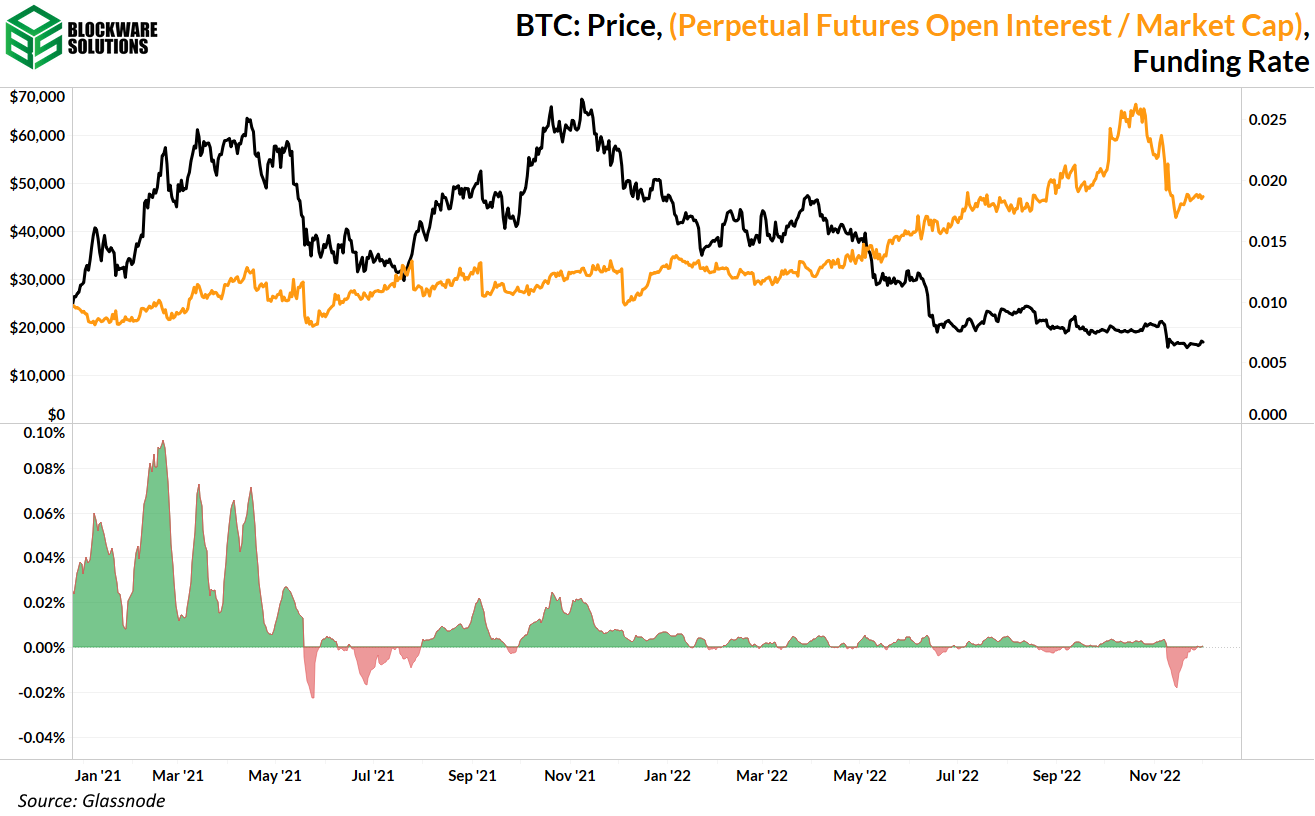
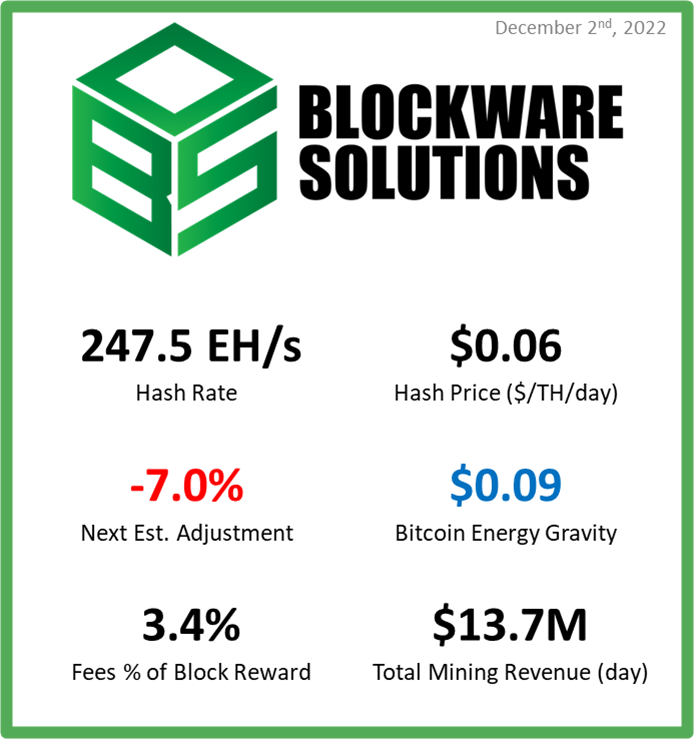
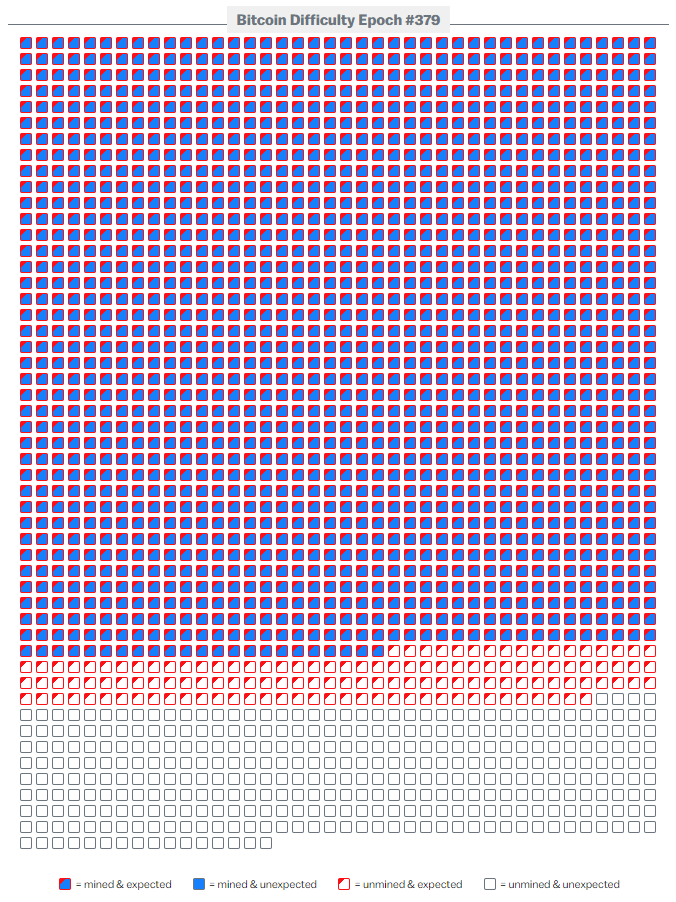
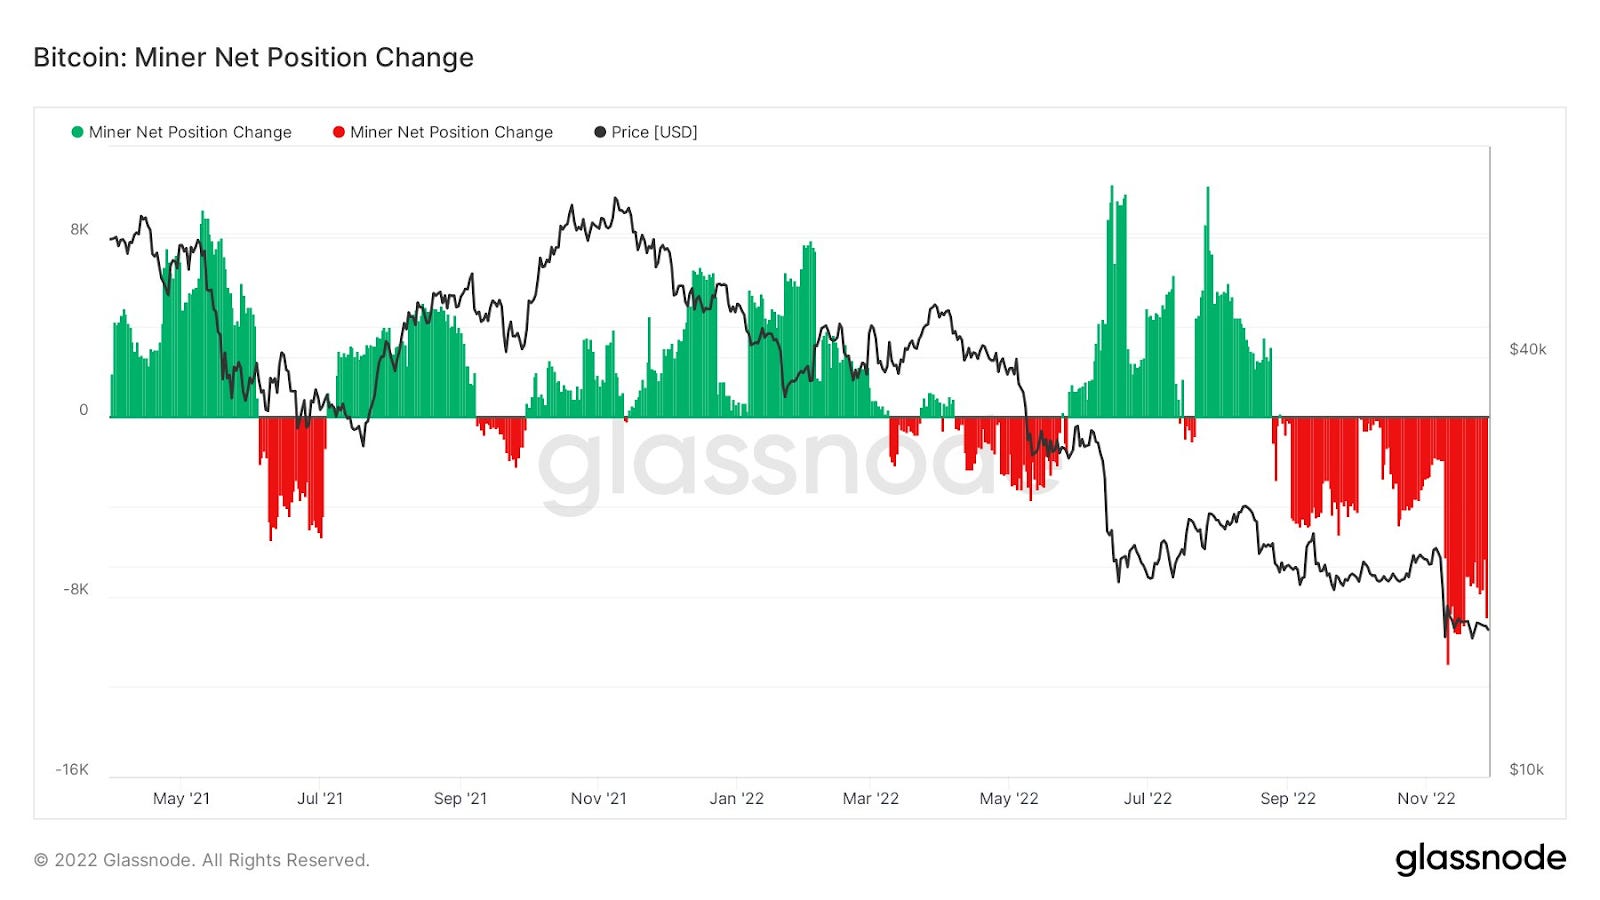
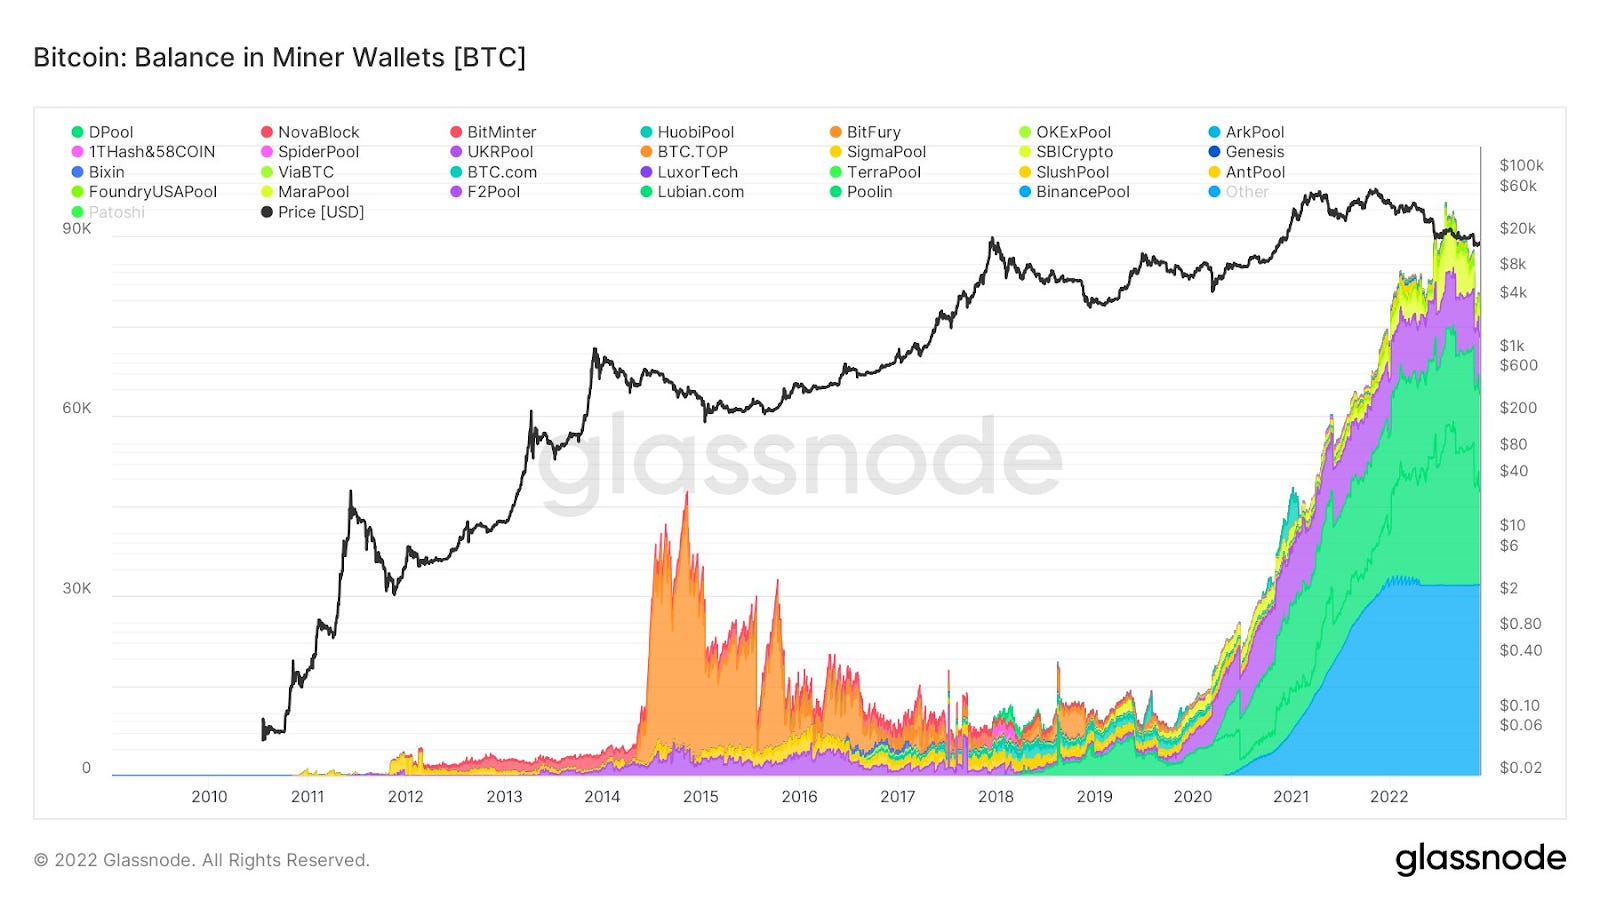
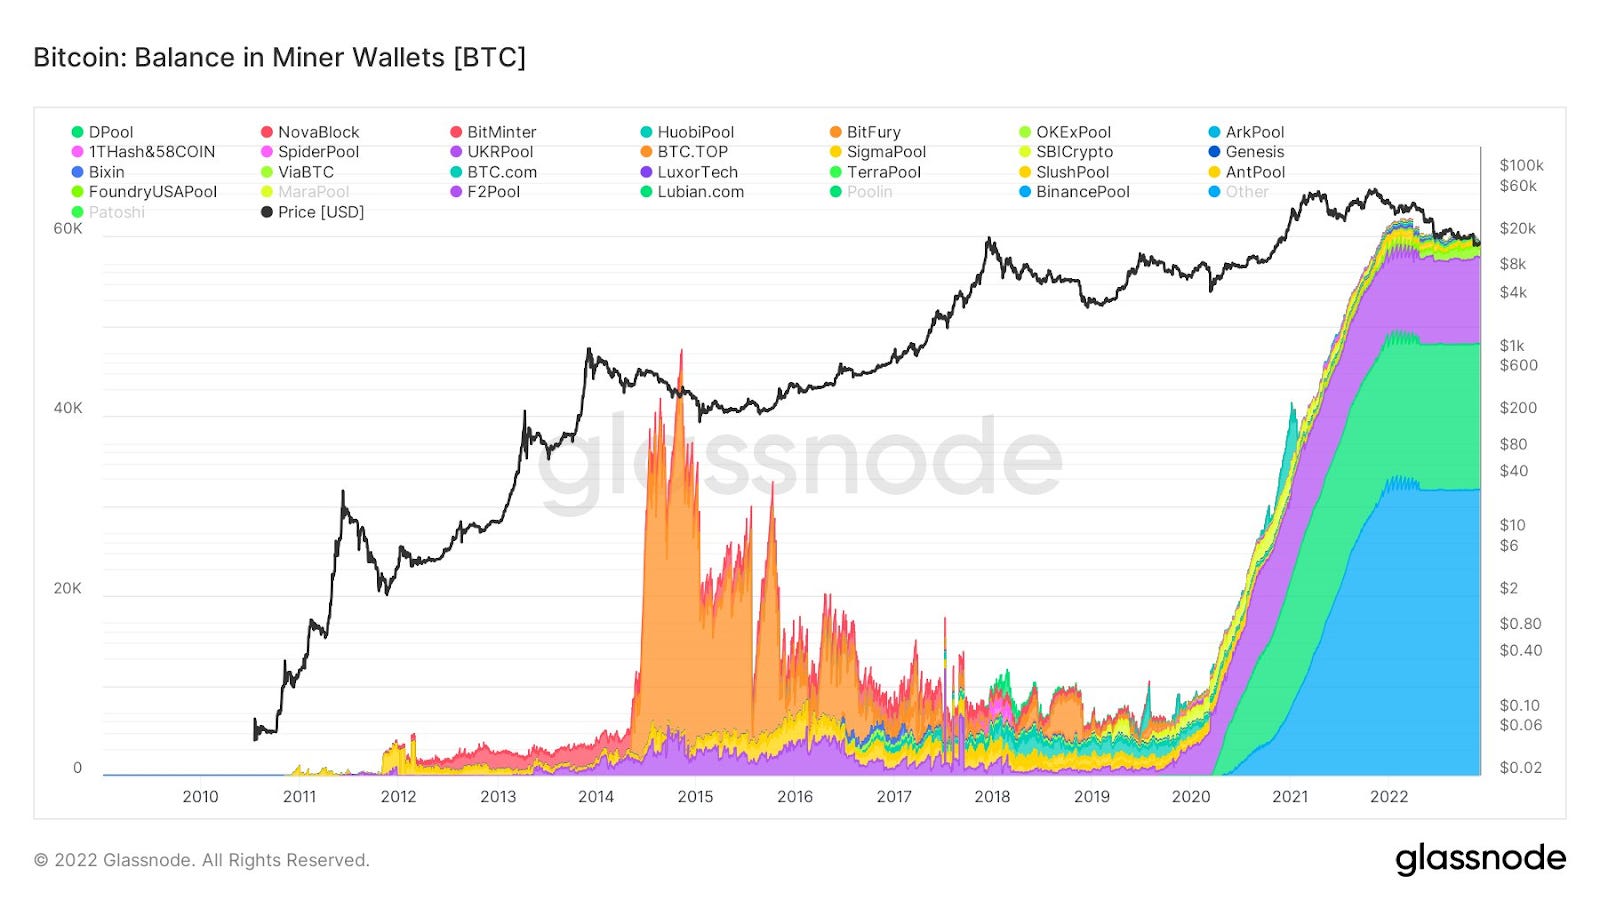
General Market Update Following the 3.5 trading days last week, it’s been an interesting week across the markets to begin the month. Eurozone Inflation (Financial Times) In November, Europe saw its first month of declining inflation for the first time in 17 months. While certainly a good sign, there’s still much work to be done to lower energy prices for the long term. As you might expect, one month of declining eurozone inflation does not mean that European central banks will stop raising interest rates. This could be a signal that Europe is now in a similar situation as the US, meaning there are signs of slowing inflation and rates must be held high to continue the decline in prices. Here in the US, we received October’s Personal Consumption Expenditures (PCE) inflation numbers this week. PCE is the inflation metric most commonly used by the Fed to measure their progress. Core PCE came in slightly under expectations at 0.2% growth MoM, and 5% YoY. While this is likely a good sign, we also received November’s jobs report on Friday morning. This report indicates that the labor market was very strong in November, which is actually a bad sign for the markets. Because the jobs market is so robust at the moment, it means that the Fed will likely have to continue raising rates, or at least hold rates elevated for a while, in order to slow down the economy. We also received new ISM PMI data for November. The PMI reading for November came in at 49%, putting us at the lowest level since May 2020. For those who don’t remember, the Purchasing Managers Index (PMI) is a survey of manufacturing manager’s outlooks on current market conditions and tends to be an extremely accurate indicator of overall economic growth. PMI readings below 50 indicate a retraction in manufacturing activity. This is something we hadn’t seen since early-2020, until now. On Wednesday, we heard from Fed Chair Powell which injected a lot of buy pressure into the markets. Powell took a fairly dovish stance on Wednesday, stating that smaller rate hikes could become a reality as early as this month. Clearly the market liked what Powell had to say as the S&P closed up over 3% yesterday. S&P 500 Index 1D (Tradingview) While Thursday was a relatively quieter day, there were signals that this rally has some serious strength behind it. The fact that sellers were unable to bring the index back lower after a very strong session shows to us that buyers are confident. This doesn’t necessarily mean that the bottom is in, and as we’ve discussed here many times, be careful when fighting the trend. The primary long-term trend in the equity markets is still down. Meaning that the market has an inherent downside bias at the moment. That being said, on Thursday the S&P was able to close above its 200-day SMA for the first time since April. Due to the fact that the 200D is a key institutional trading tool, this is a good sign for bulls. In fact, with Wednesday being the last day of November, the index was able to post back-to-back monthly gains for the first time since August 2021. In the fixed-income market, we’ve seen a strong week for Treasury prices. US 2-Year Treasury Yield 1D (Tradingview) On Wednesday, the yield of the 2-year Treasury declined by 0.165%. This was the strongest session for Treasury prices we’ve seen since early-November. Thursday was also a fairly strong session for the 2-year, with yields falling an additional 0.076%. Unsurprisingly, this ushered in a weak session for the US dollar. US Dollar Currency Index 1D (Tradingview) On Wednesday, DXY declined by 0.90%, and on Thursday extended its losses by over 1%. At the close on Thursday, DXY sat XX% off its September highs. This is another strong signal that the markets may have bottomed. DXY closed the month of November with a loss of 5.11%, its worst month since September 2010. This combination of declining yields and the dollar is a recipe for strength in equities. That being said, the dollar is now reaching oversold territory, and stocks are due for a pullback. Crypto-Exposed Equities With the price strength that Bitcoin showed on Wednesday, it’s overall been a strong week for the crypto-related equity group. Investors should be cautious of the potential bear flag that many of these names appear to be forming at the moment. It likely wouldn’t take much for these stocks to break back down lower. That being said, many crypto-equities have seen nice bounces this week. Specifically, MSTR, BTCM, RIOT, and BTCS appear to be the names showing the highest levels of relative strength this week. Many other names have essentially just moved sideways this week, despite all that’s going on across the markets. It’s possible that those names have simply grown to become unaffected by bear market narratives, but more likely to be digesting recent losses before making their next move. Above, as always, is the table comparing the Monday-Thursday performance of several crypto-equities. Bitcoin Technical Analysis Following the last 3 weeks of sideways price action, it was nice to see BTC break out of this range to the upside. BTCUSD 1D (Tradingview) While certainly a good sign for the time being, it’s impossible to say whether or not BTC has bottomed yet. I would still wager that it’s more likely that we haven’t bottomed yet. Ideally, we would see BTC put in a higher-high on the weekly chart, something that it hasn’t been able to do since March 2022. At the moment, this would mean a break above $21,500. Heading into next week, keep an eye on BTC to run into resistance around the previous June lows around $17.5k. Bitcoin On-chain and Derivatives We have reached a zone that has historically been the “second half” of bear market bottoms. The green zone occurs when the price is below the realized price; ie. a majority of entities are underwater. The purple zone occurs when the realized price of short term holders is below the aggregate realized price; ie. new market participants have a lower cost basis than the rest of the market as a whole. This means that it is objectively a good time to accumulate; sats stacked at this level will have a lower cost basis than almost all market participants. The prior times in which this situation has occurred has been during the late stages of the bear market bottom. This supports our thesis that we are closer to the end of the bottom than the beginning. SOPR (spent output profit ratio) is the ratio of a UTXO’s realized price when it is moved and the realized price of that UTXO at its creation. In layman’s terms, it shows the difference between the price of a Bitcoin as it is moved relative to the last time that it was moved. This adjusted version of SOPR simply excludes UTXOs created and moved within 1 hour; traders or users consolidating UTXOs. High SOPR values indicate profit taking, low SOPR values indicate capitulation. What we have seen recently is the largest capitulation since the 2018 bear market bottom. Realized losses adjusted for market cap shows that this drawdown brought a similar amount of capitulation relative to the drawdown from the summer. Technically, there was long term holder capitulation. The long term holder supply, which has been up only for the past few months, declined approximately ~100,000 BTC which is no insignificant amount (it has since retraced most of this decline). For reasons I will outline below, this decline in LTH Supply can be somewhat misleading. The threshold constituting a “long term holder” on glassnode is 155 days; about 6 months. That just so happens to be right around the time we initially dropped to $30k and then to $20k. Below I have charted the supply of BTC last moved 6-12 months ago, and beneath that is the supply of BTC last moved 1+ year ago. The charts show that the capitulation was clearly from the first cohort. The supply last active 1+ year ago has continued its recent trend of mostly flat movement with a slight increase; being up 10% YTD. The main point here is that the capitulation was not from entities that have held since last year’s all-time high. Rather, it was from coins that were accumulated in the first half of this year. The zoomed out view of the supply last active 1+ year ago shows that we are unequivocally in the bottom part of the broader cycle. In the short term and the long term, this metric will continue to climb as Bitcoin’s convicted user base serves as the buyers of last resort. Accumulation trend score is a metric of accumulation weighted by the size of an entity’s BTC holdings. The score being closer to 1 (purple) indicates high levels of accumulation among entities with large holdings. We can see just how strong the accumulation from large entities has been by looking at the 2 week difference in the holdings of entities with 10 – 100 BTC. The last time we saw this much accumulation from this cohort was prior to the blow off top of the 2017 bull run. The insane build up of perpetual futures contracts has finally cooled off. The funding rate has remained negative for two weeks now which could indicate that we are at least a local bottom, and potentially a market bottom. Bitcoin Mining Next Estimated Difficulty Adjustment In the mining industry, there has been a lot of discussion around the estimated next difficulty adjustment. This was covered in last week’s newsletter, but 7 days later and difficulty is still projected to decrease by a significant amount. Last week our estimate was -6.0%, but now it appears that it may even be further down. Mining difficulty is adjusted indirectly based on the total network hashrate. Hashrate cannot be measured directly by the Bitcoin network so instead, the Bitcoin network uses block times to adjust hashrate. If blocks are coming in faster than every 10 minutes (on average), then difficulty adjusts up. If blocks are coming in slower, then difficulty adjusts down. Currently, the network is ~ 134 blocks behind schedule for this epoch. Here is a visualization of the current difficulty epoch. https://www.bitrawr.com/difficulty-estimator Glassnode’s “Miner Balances” Many have been speculating that miners have been unloading their BTC balances somewhat aggressively recently. While it’s possible, that may not necessarily be the case here. Bitcoin miner balance on Glassnode is calculated by identifying the wallets associated with Bitcoin mining pools. MaraPool and Poolin were the two mining entities that saw significant drawdowns in their wallets. It’s important to note that just because coins leave a mining pool does not mean miners have sold those coins. For most mining pools the process is almost always something like this: block reward payout -> mining pool -> individual miners’ wallet / cold storage. This is two hops at a minimum and the coins are still not being sold. Removing Marapool and Poolin (chart below), you can clearly see the recent “sell pressure” from miners was only these pools. Considering we haven’t heard that MARA has sold 3,000 – 5,000 BTC it’s likely they are shuffling coins into different addresses. It’s likely the same with Poolin. It’s the mining pool shuffling addresses or individual miners withdrawing. Poolin accounts for ~ 8,000 BTC that many claim has been sold. This is not to say we won’t see another wave of miner bankruptcies, but many of the companies on the verge of bankruptcy have little or no BTC left to sell. All content is for informational purposes only. This Blockware Intelligence Newsletter is of general nature and does consider or address any individual circumstances and is not investment advice, nor should it be construed in any way as tax, accounting, legal, business, financial or regulatory advice. You should seek independent legal and financial advice, including advice as to tax consequences, before making any investment decision.
© 2022 William Clemente III |

