Blockware Intelligence Newsletter: Week 76
Blockware Intelligence Newsletter: Week 76Bitcoin on-chain analysis, mining analysis, macro analysis; overview of 2/18/23-2/24/23
Blockware Intelligence Sponsors If you are interested in sponsoring Blockware Intelligence email: sponsor@blockwaresolutions.com.
Summary:
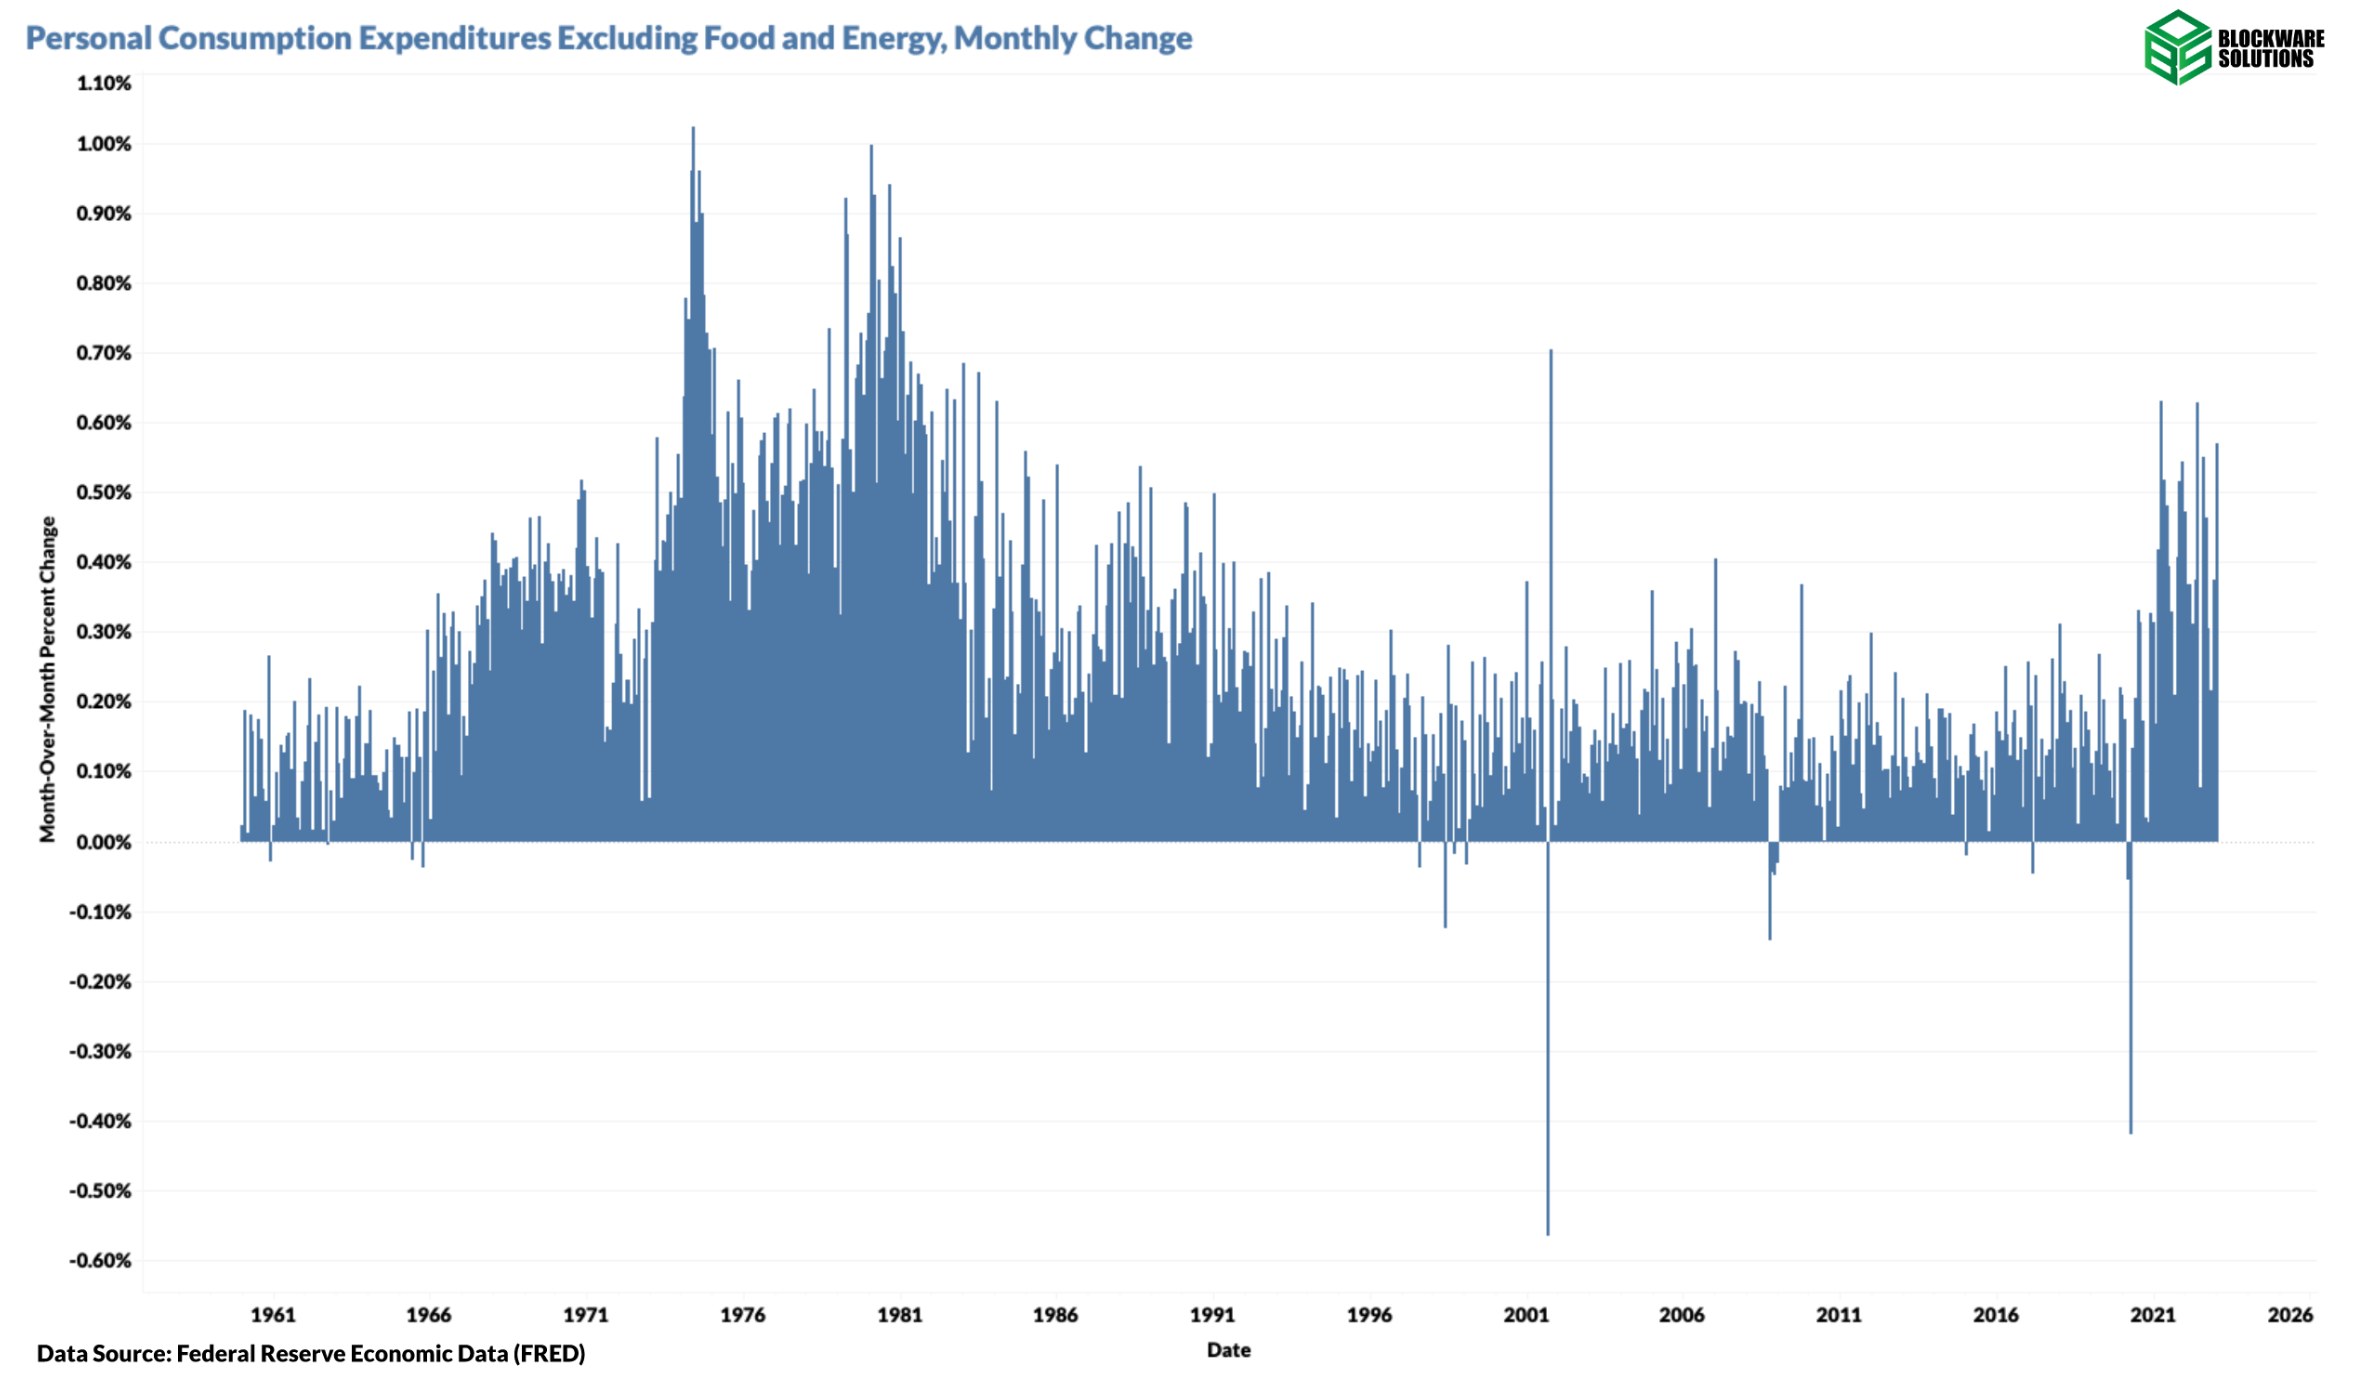
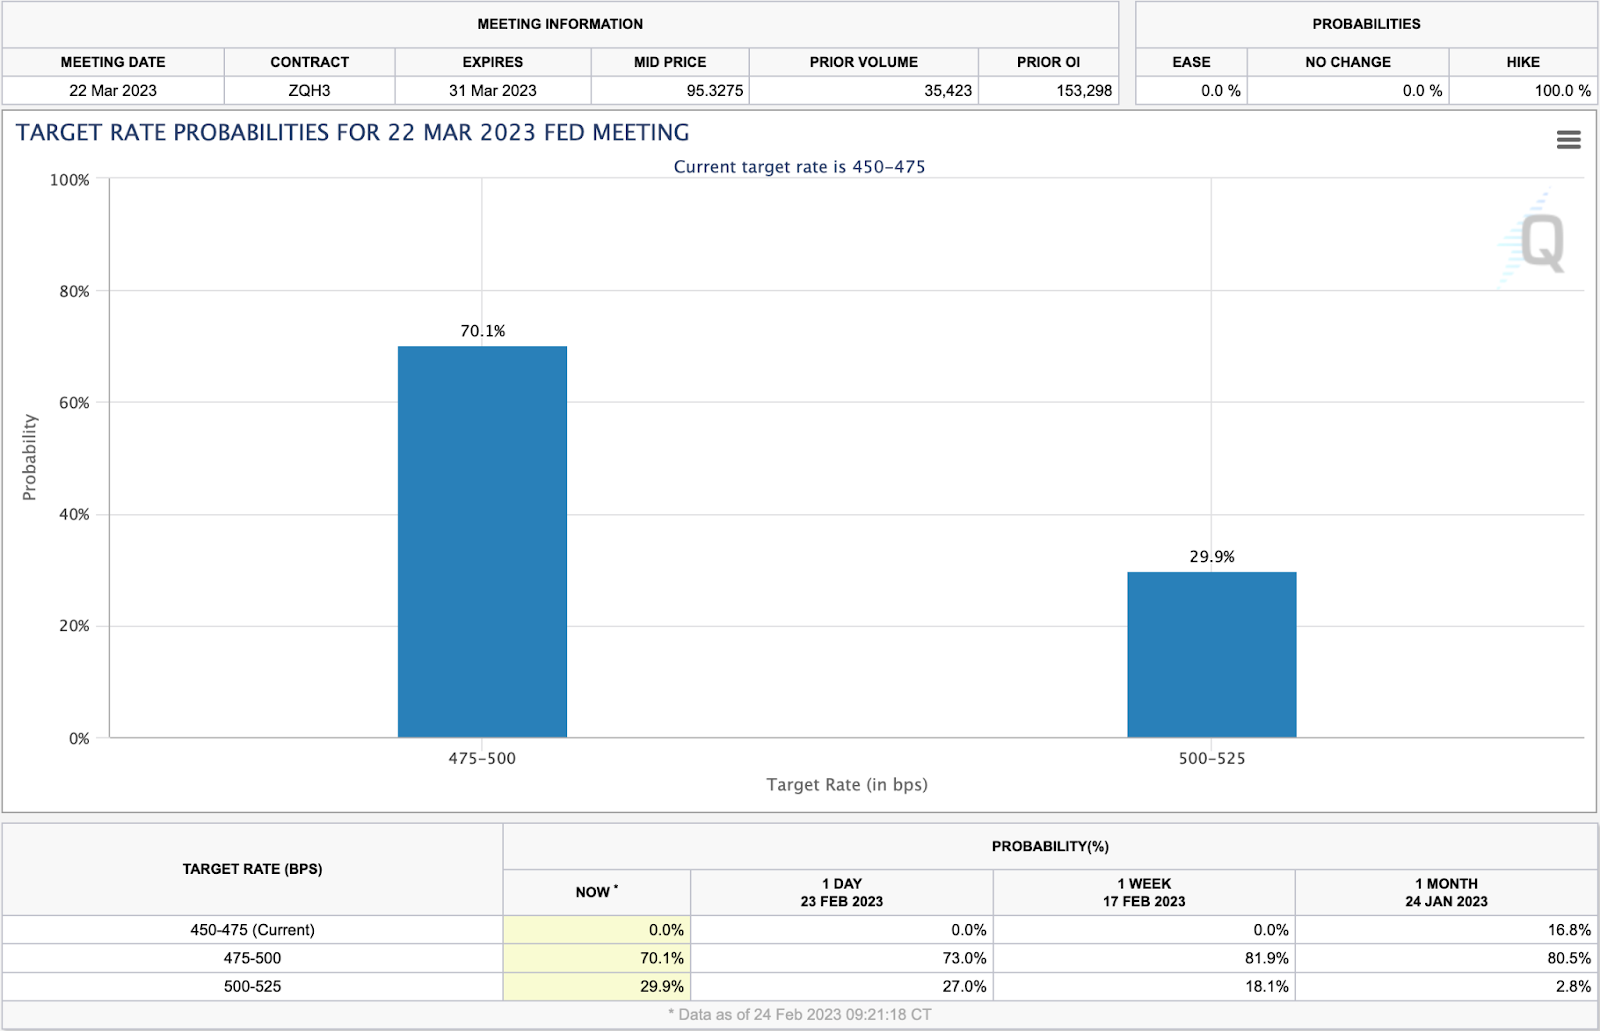
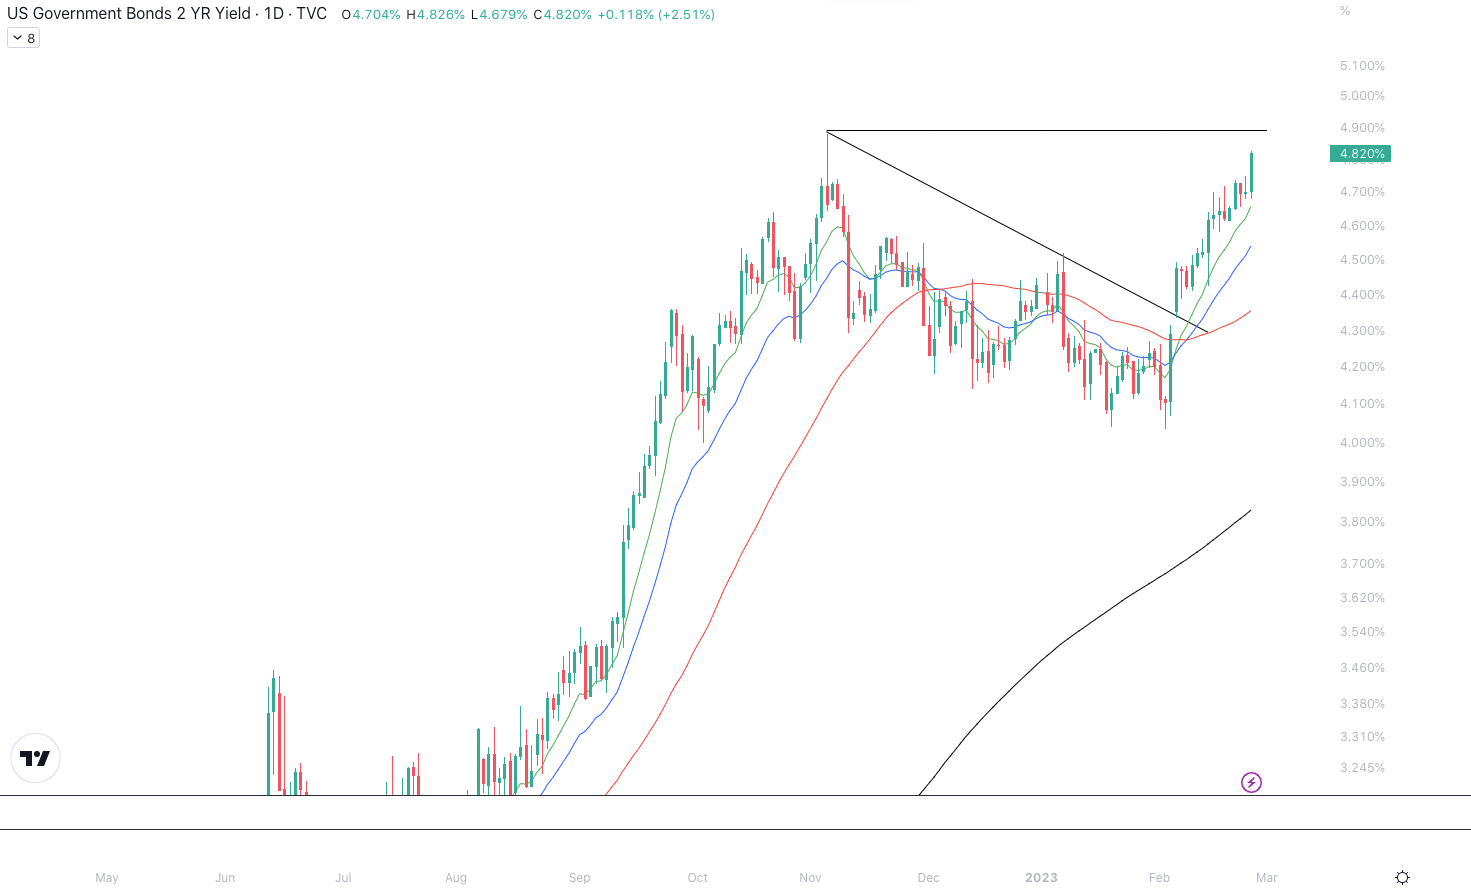
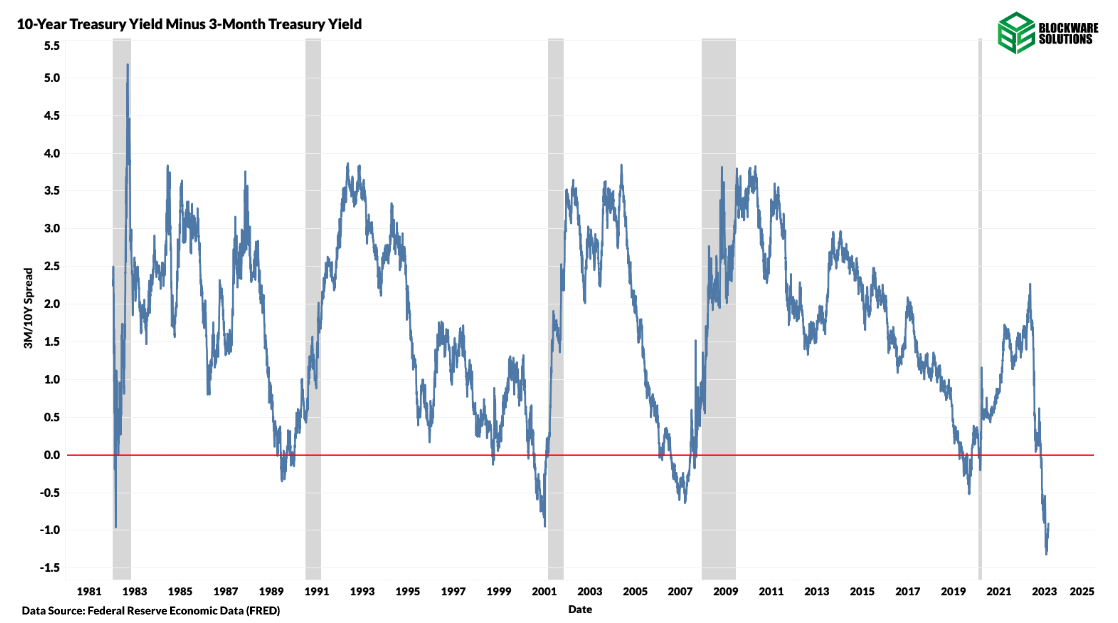
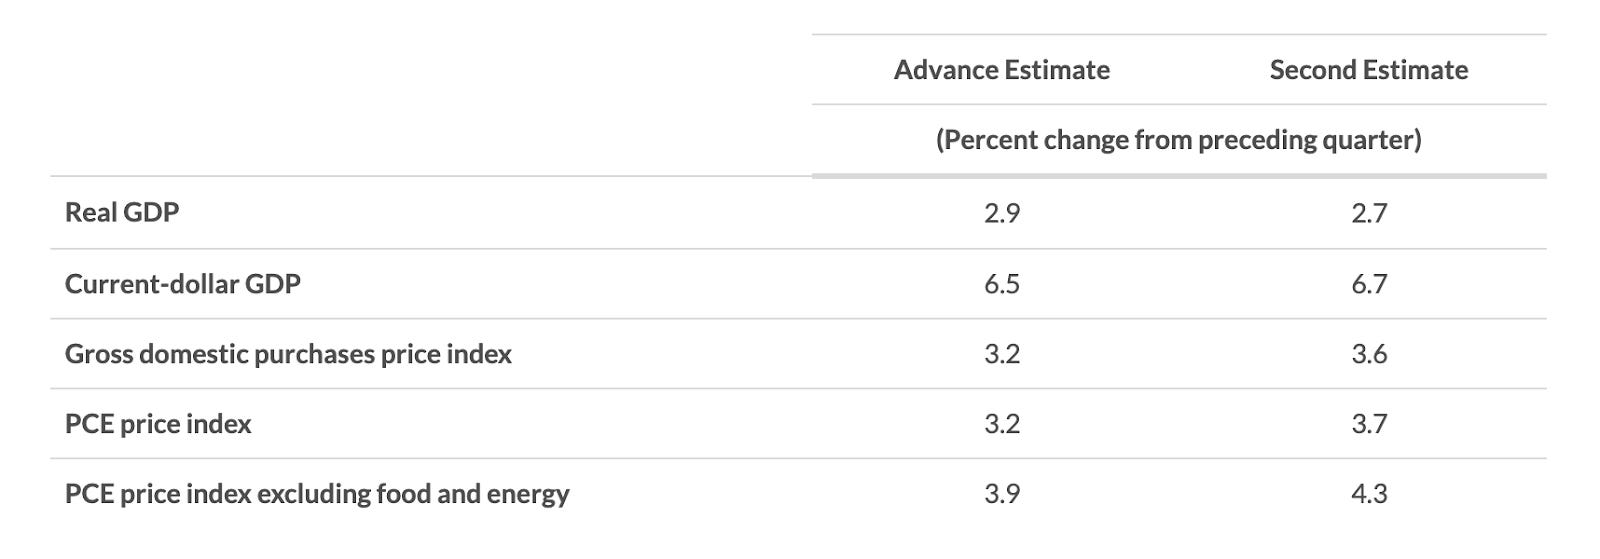
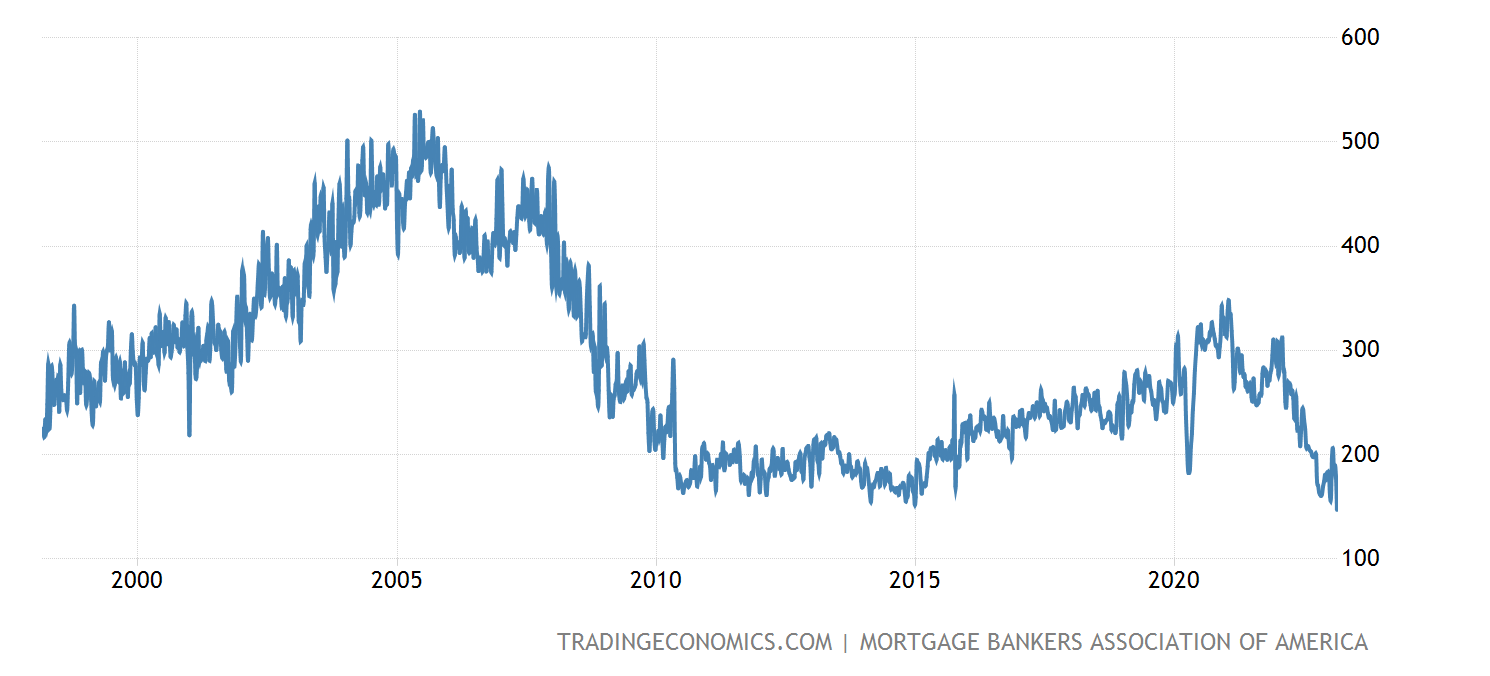
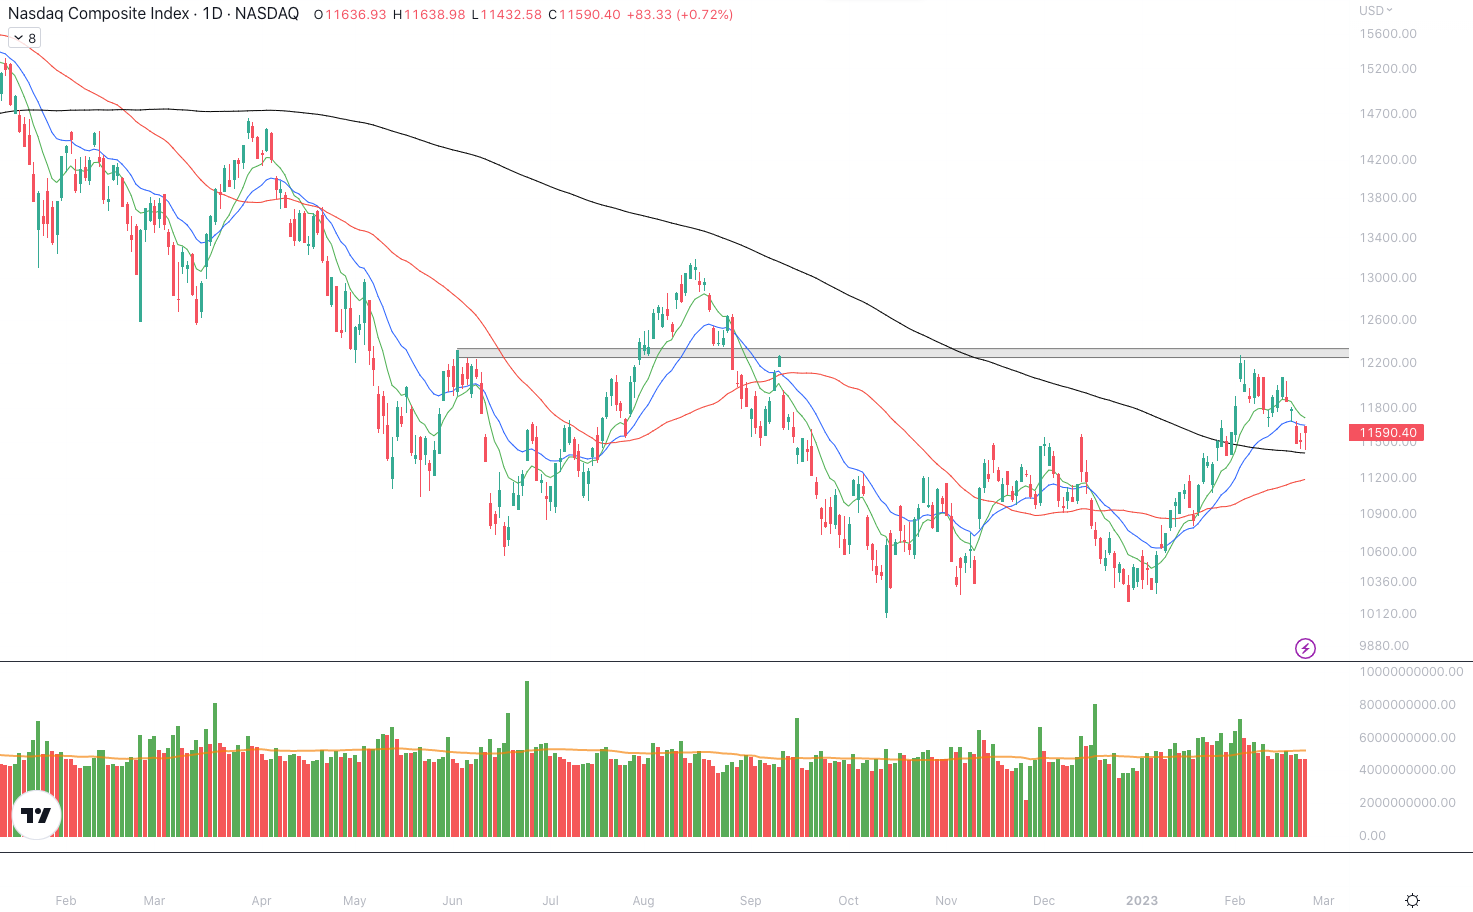
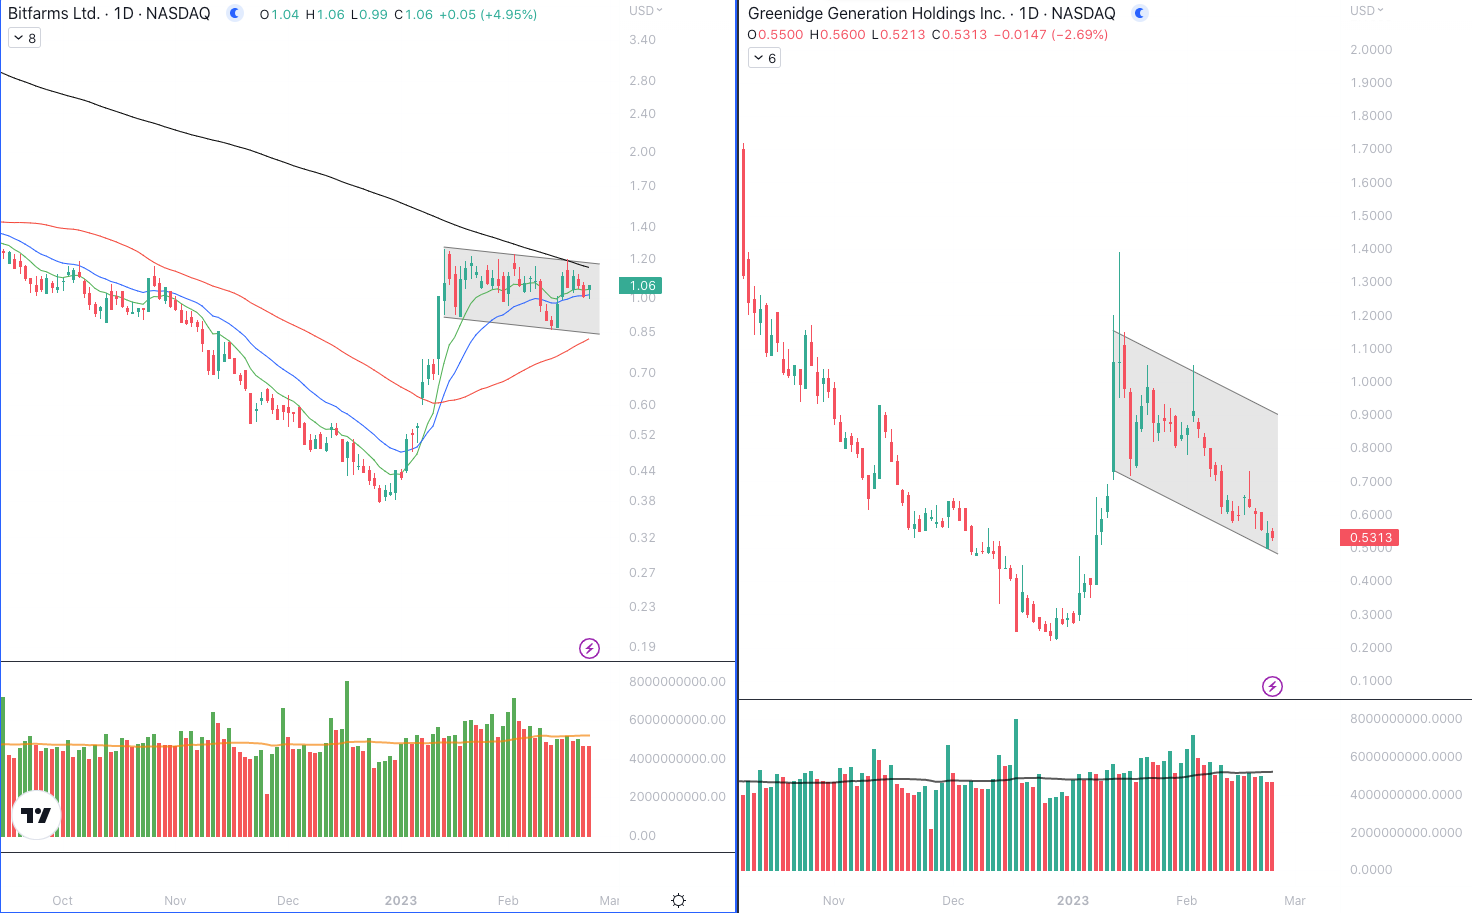
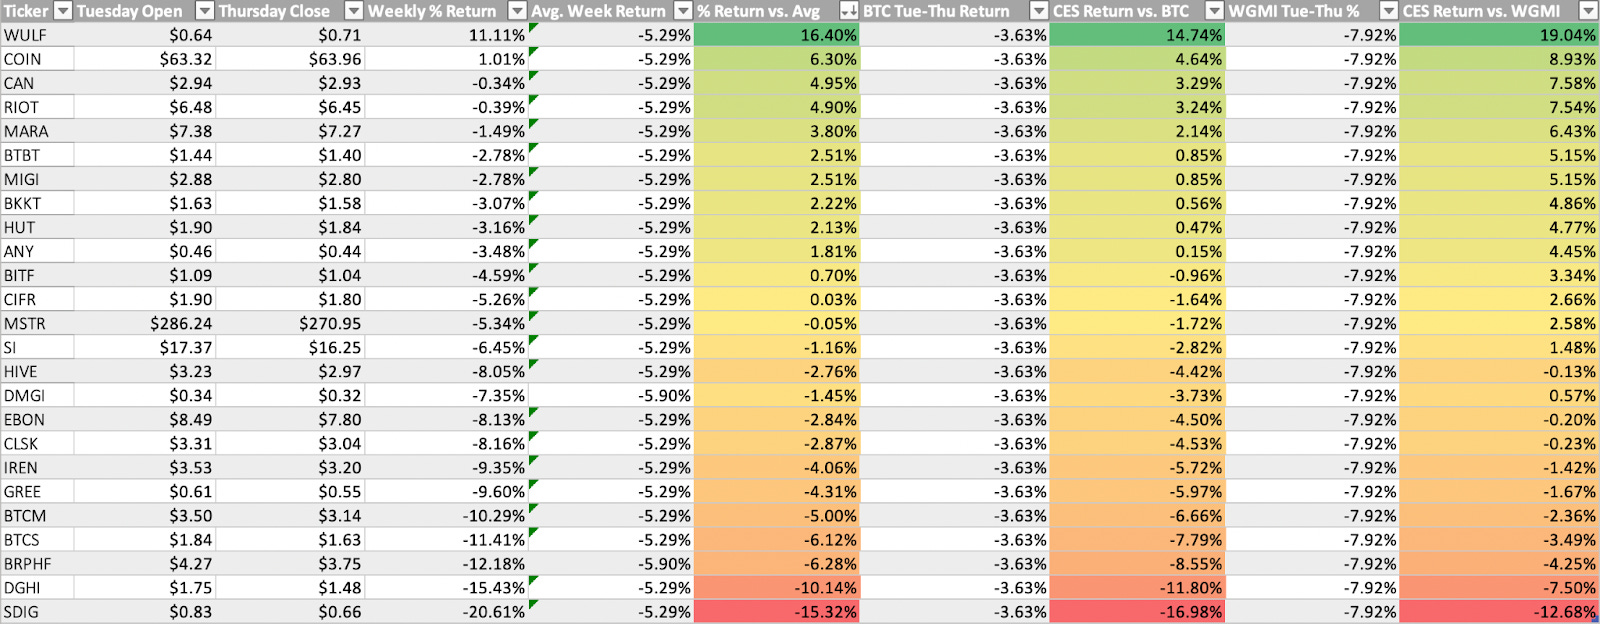
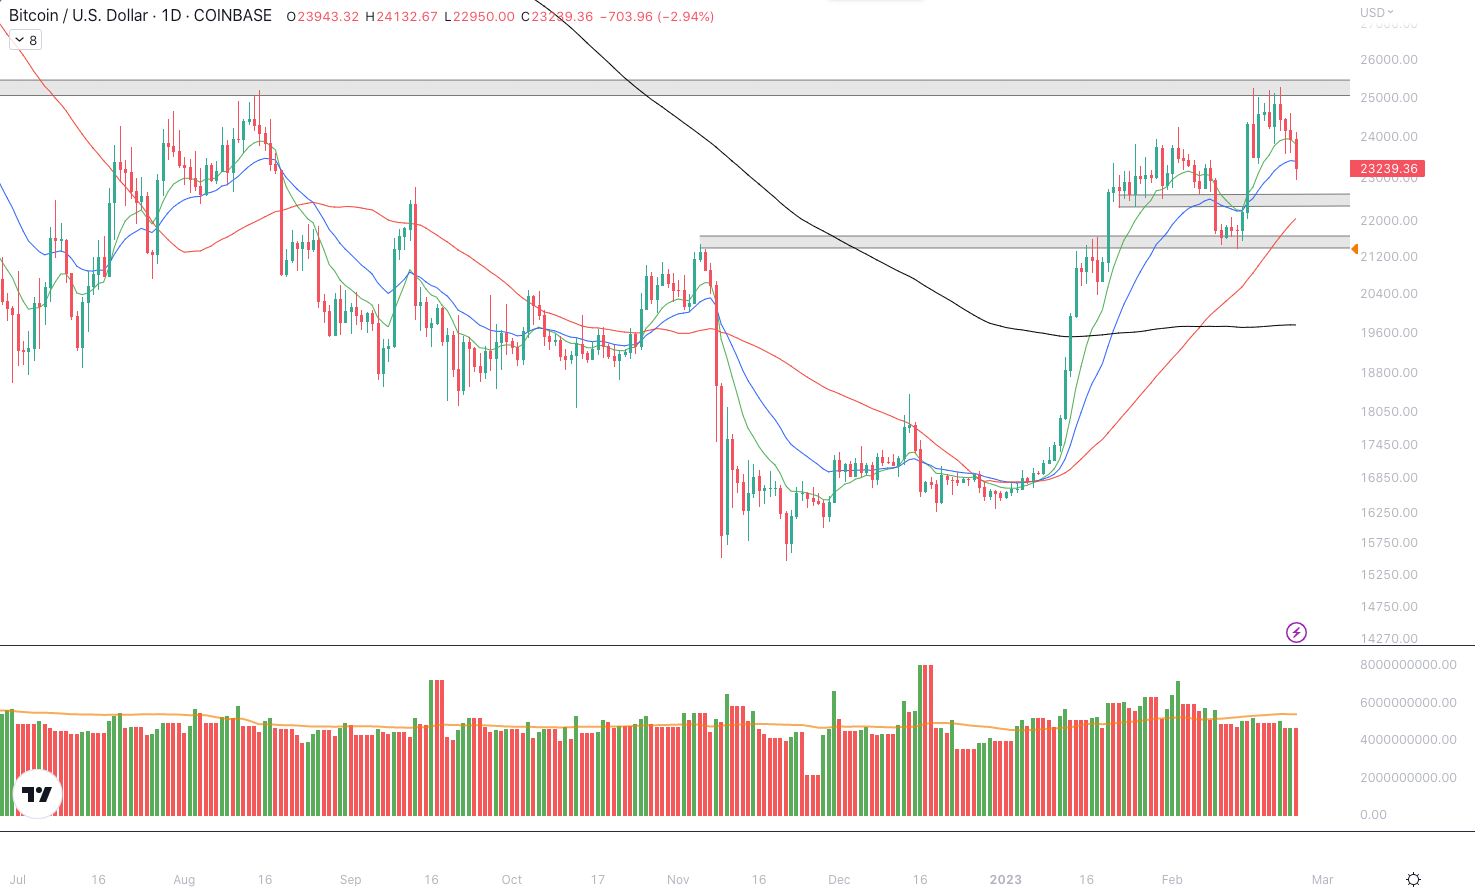
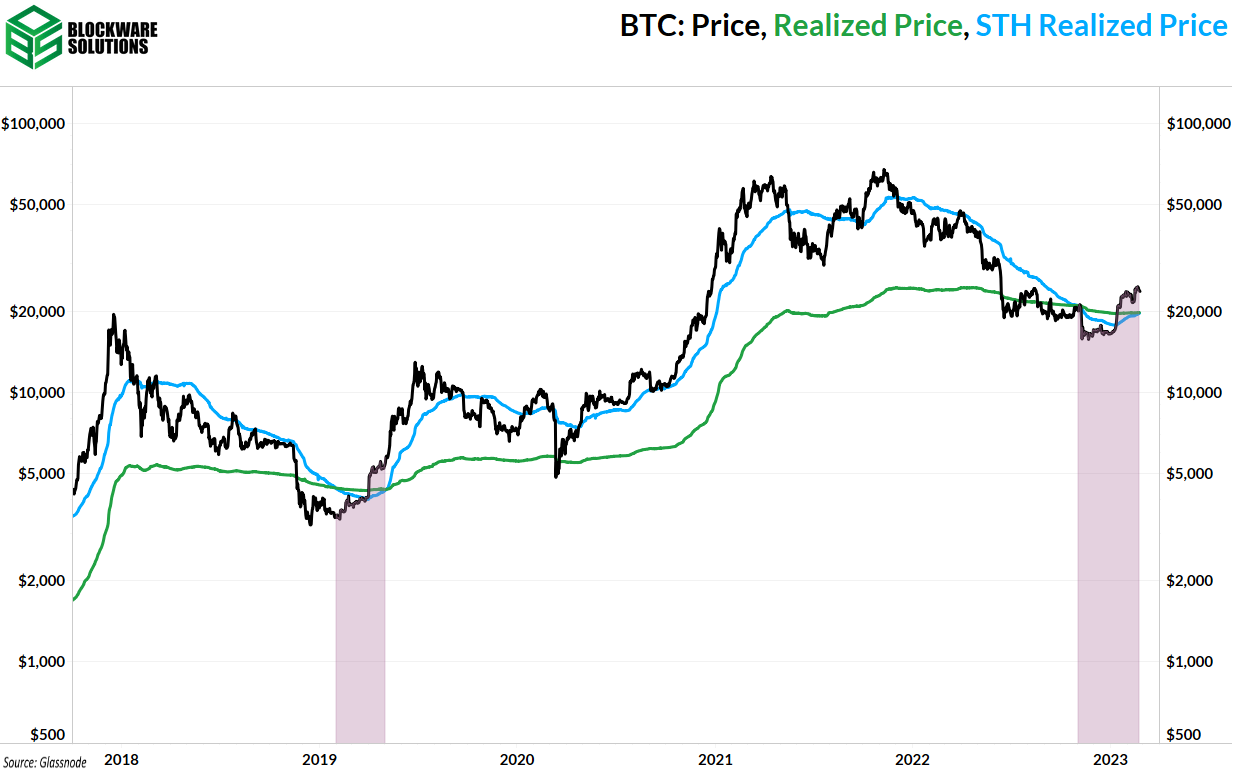
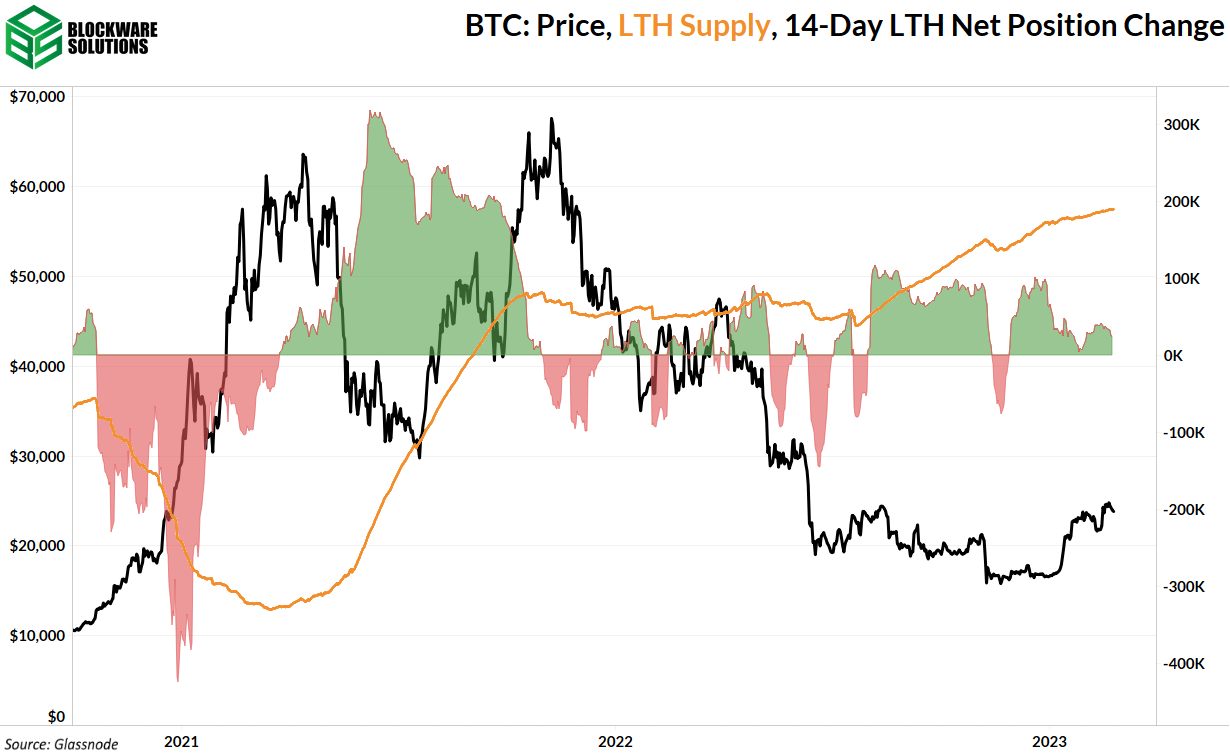
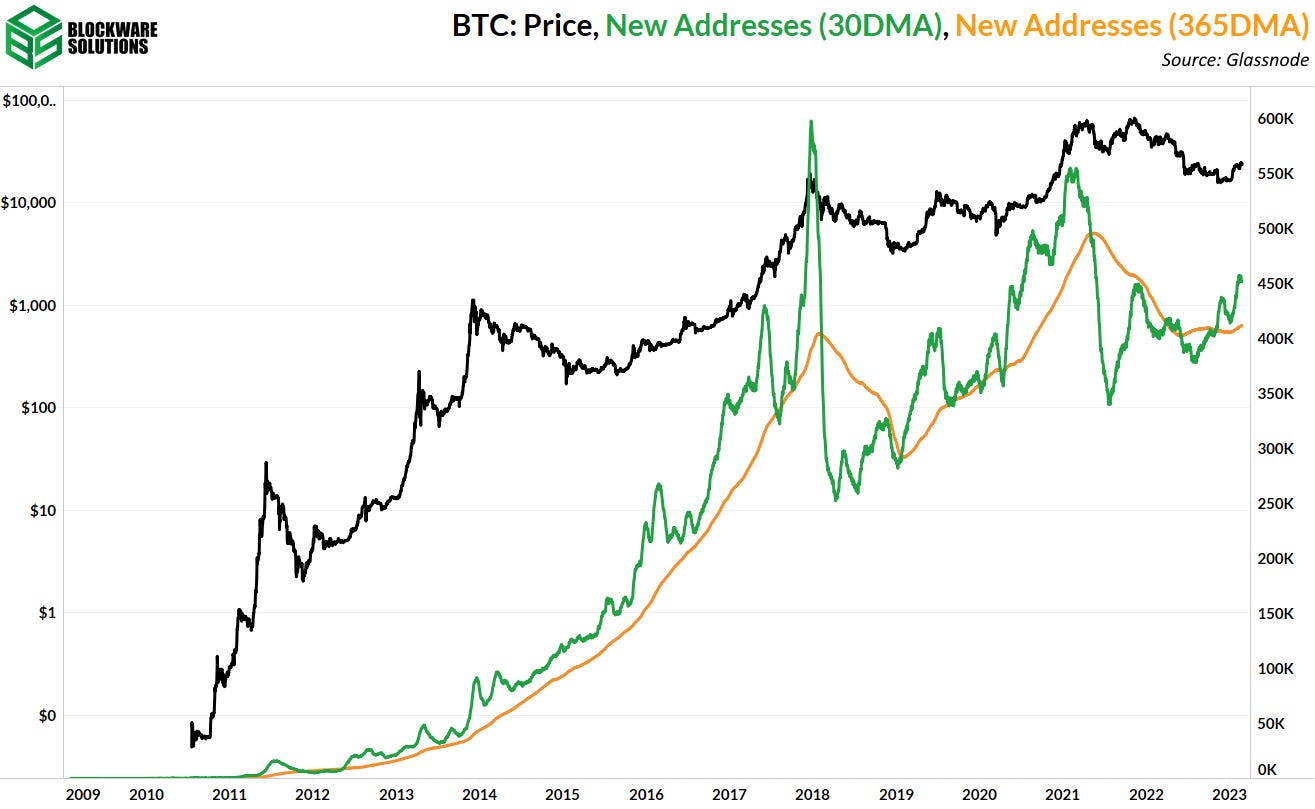
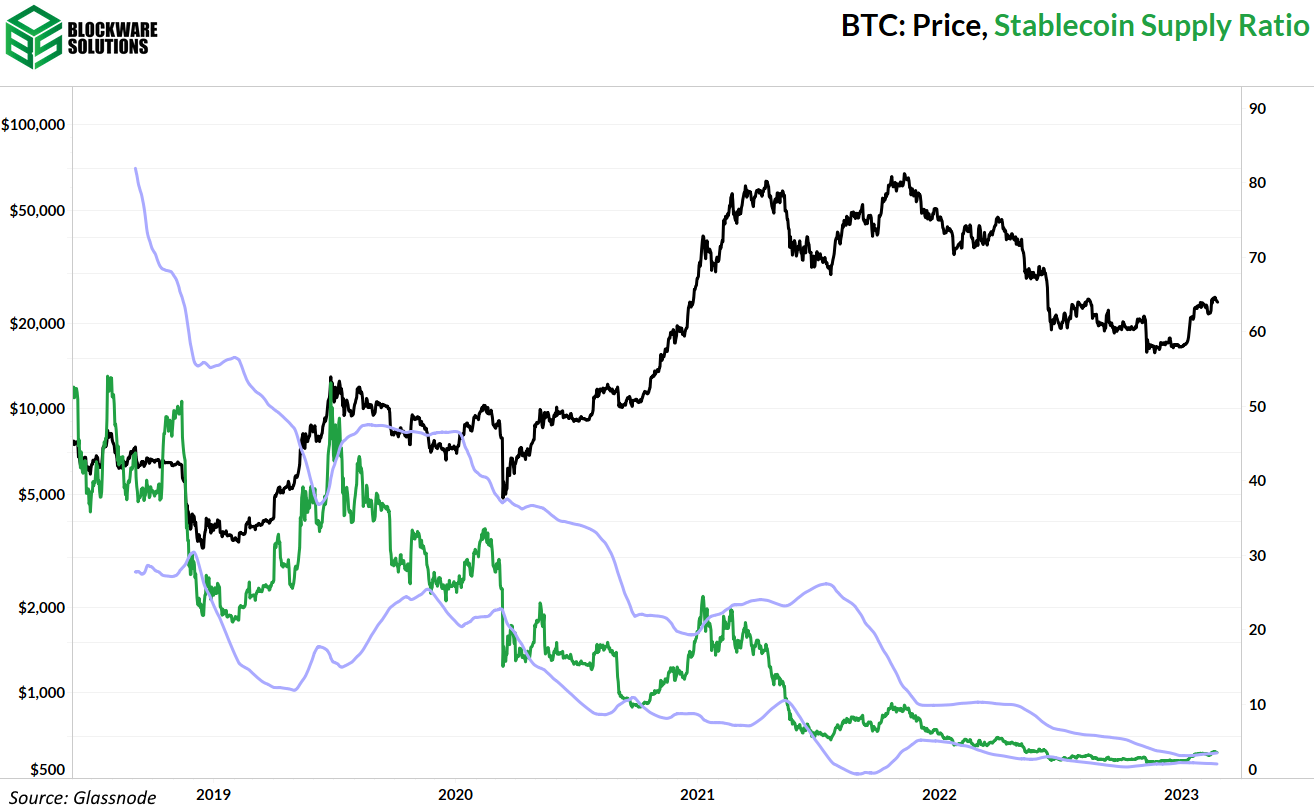
General Market Update While it was a shortened trading week, there is still plenty to discuss this week across the general market. On Wednesday, we got the release of the Fed minutes, or a record of the behind the scenes at FOMC from February 1st. If you’re a consistent reader of Blockware Intelligence then the results shouldn’t surprise you. There was a unanimous vote to raise rates by 25bps, with a couple of officials voicing support for 50bps. Fed officials also reiterated a long-held conviction to keep rates higher for longer. This morning, data from January’s Personal Consumption Expenditures (PCE) report was released showing 5.4% YoY growth for Headline PCE. Core PCE was up 4.7% YoY and 0.6% MoM. These numbers were all above expectations. The chart above shows the MoM change to Core PCE dating back to 1960. As you can see, there have only been a few instances where Core PCE’s MoM change has spiked since the 80’s. After the 1980s, the only instances where Core PCE surpassed 0.4% MoM were 1990, 2001, 2007, 2009 and 2021-2023. Core PCE is the Fed’s favorite inflation metric, now that we’re seeing it come in hotter-than-expected, it only adds more evidence to the idea that the Fed must raise rates higher for longer. This is something that our team has been discussing for months. Our 2023 Market Forecast spoke about this in-depth, stating that inflation would likely not decline at the rate initially expected, which would result in the Fed raising rates above 5% and holding them there throughout 2023. Based on February’s FOMC minutes, this appears to be the path forward for monetary policy. Currently, the market is attempting to catch up. FedWatch Tool, March 22nd FOMC (CME Group) The Fed Funds futures market is now predicting that we will see 25bps hikes in March, May and June. The market is also pricing in a fairly significant chance of the Fed going for 50bps in March. From there, the market believes that the Fed will hold rates at 5.25% before pivoting in December. Obviously a ton will change between now and December, but based on current Fed posturing, this is the most likely scenario according to the market. With future rates rising, it isn’t surprising to see Treasury yields in their first uptrend since November. US 2-Year Treasury Yield, 1D (Tradingview) At the time of writing on Friday, the 2-year has touched 4.82%, its highest yield since November 4th, as you can see above. On Thursday, the 10-year briefly touched 3.98%, also its highest value since November. The 2-year is considered the most policy sensitive Treasury, meaning that we will likely see its yield surpass well above 5%. That said, we have seen a rebound in yield spreads, indicating that investors’ risk concerns are shifting. Deeply negative spreads indicate that investors are more concerned about short-term macro risks than long-term ones, now investors appear mostly concerned about longer-term interest rate risk. As you can see above, with recessions highlighted as gray vertical bands, the US has generally entered a recession not long after yield spreads have crossed from deeply negative back above 0. You can also see that the spread between the 3-month and 10-year yields have begun to rebound. That being said, there is still a lot of ground to cover between the 10-year’s ~3.9% yield and the 3-month’s ~4.8% yield. Furthermore, the time it has historically taken between this spread crossing back above zero and official declaration of recession has been anywhere from 1-18 months. With that, on Thursday morning advanced Q4 real GDP estimates were released. For those who aren’t aware, GDP numbers are estimates due to the fact that it’s essentially impossible to measure every penny of output across a large advanced economy. Advanced estimates are released, and then are revised later on as more data comes in from the previous quarter. February 23rd Real GDP Updates (BEA) On January 26th, the Bureau of Economic Analysis (BEA) stated that their advanced estimates showed 2.9% real GDP growth for the US in Q4. Thursday morning, that number was revised down to 2.7% following changes to PCE inflation and consumer spending numbers, as you can see above. Nominal GDP was actually adjusted upwards, but due to Q4 PCE inflation also being revised upwards, real GDP was adjusted down. To be fair, we are now discussing economic activity from several months ago, but the fact that the BEA believes that real output grew less than initially expected isn’t a great sign. Q4 GDP estimates will be revised again on March 30th. Furthermore, data from the housing market supports the idea of growth potentially beginning to slow in the US. The average 30-year fixed mortgage rate for the US has started to tick higher in recent weeks. It currently sits at 6.6%, which is up from 6.1% for the week of February 2nd, but down from its recent peak of 7.1% in November. As mortgage rates rise, it makes sense that less folks are signing mortgages. MBA Purchase Index, 1W (TradingEconomics) Last week, the MBA’s purchase index, which measures mortgage application volume, declined by 18.1% to 147.10. According to this index, mortgage applications are at their lowest level since 1995, meaning more people were attempting to finance a home at the depths of the 2008 Housing Crisis than are today. That being said, we’ve yet to see an uptick in mortgage delinquencies. A delinquency occurs when the borrower hasn’t made a payment in over 30 days, foreclosure occurs after 120 days of delinquency. From 2007 to 2010, delinquencies (as a % of total mortgages) rose from 2% up to 11.5%. As of Q4 2022, they were at 1.77%. That being said, we will very likely see them begin to tick higher in 2023 as rates continue to increase. As a result of increased economic uncertainty and Treasury yields, we finally saw the stock market cool down a bit this week. Nasdaq Composite Index, 1D (Tradingview) This week we saw the Nasdaq decline past its 21-day EMA after bouncing off it on Friday. This pullback was on light volume. On Thursday, following releases of much of the economic data discussed previously, we saw the index initially gap up to begin the session. Intraday we saw a massive reversal down to Wednesday’s lows, but the index then reversed higher to close up 0.72% on the session. Despite the macro pressures being placed on the market, bulls still appear fairly hungry. That being said, sentiment tends to change very quickly and aggressively. Crypto-Exposed Equities In the realm of crypto-equities, it’s been a quieter week as most names drift sideways or lower to consolidate the gains made in January. During these congestion periods, we look for names who are putting in tighter flags and drifting slightly downwards. This indicates stronger liquidity and conviction from buyers. BITF vs. GREE, 1D (Tradingview) The chart above is a good example of this concept. Notice how BITF (left) has been putting in a relatively tight and sideways/slightly-downward consolidation channel. GREE, on the other hand, has put in an extremely loose and downwards sloping “consolidation”. Heading into next week, we’re looking for names to break their upper trendlines if Bitcoin can catch a bounce. Above, as always, is the excel sheet comparing the Tuesday-Thursday price performance of several crypto-equities. Bitcoin Technical Analysis As of Friday morning, Bitcoin stands at a fairly similar spot as last week. Bitcoin/US Dollar, 1D (Tradingview) Following the immense strength shown by Bitcoin in 2023, our team has been looking for a slightly downwards/sideways consolidation to incentivize new buyers to enter the market. At the time of writing, BTC has broken down below its 21-day EMA. If prices continue to break down we see likely support levels at $23,000, $22,350, and $21,500-600. As mentioned last week, our team finds the most likely short-term scenario to be choppy price action between $21,500 and $25,000. Heading into the weekend, look for BTC to reverse and close above its 21-day at ~$23,400. Bitcoin Onchain and Derivatives Short-term holder realized price (STH RP) has increased slightly since last week’s newsletter but has not yet passed realized price (RP). The two metrics are basically at the same level meaning that short-term holders, on average, have a cost-basis similar to the average cost-basis of all market participants. As the price spends more time moving sideways at the current level, or if it makes another move up, STH RP will cross above RP, which has historically signaled the end of bear markets. A key on-chain structure of bear market bottoms is long-term holders, acting as buyers of last resort, accumulating a large percentage of the supply. This is still occurring despite the price being up ~50%. The long-term holder supply has continued to push to new all-time highs every single day. Over the past week, long-term holders have collectively accumulated ~18,000 BTC. The combination of HODLing from long-term market participants as well as steadily increasing activity on-chain (which we will get into below) is a recipe for further price appreciation. Decreasing liquid supply + increasing demand = the price must get bid higher. In the above paragraph, I mentioned steadily increasing on-chain activity. I want to emphasize steadily. We haven’t, and likely will not, see massive amounts of market participants flood back in overnight. However, what we are seeing is a shift in the overall trend. New address momentum has been increasingly positive over the past couple of months. This is indicated by the 30-day moving average being greater than the 365-day moving average. The stablecoin supply ratio measures the buying power of stablecoins relative to the market cap of BTC. Lower values indicate more stablecoins are on the sidelines, able to be deployed into BTC. The stablecoin supply ratio has hit the upper bound of its Bollinger Bands (200DMA +/- 2 St. Dev.) for the first time since the bull market, showing that, relative to the past 200 days, stablecoin holders have begun deploying into BTC. There is still plenty of stable-coin buying power on the sidelines though. This ratio has trended lower over the long term as the stablecoin market grows and thus the buying power of stablecoins relative to BTC increases. Growth in the stablecoin market is interesting because it shows people are clearly seeing the value in friction-free, borderless payments. However, stablecoins are still fiat-denominated and issued and controlled by centralized third-parties. And, as such, they pale in comparison to Bitcoin as a long-term store-of-value and as a trustless bearer asset. The way I look at this is that stablecoins have a much higher probability of being deployed into BTC compared to regular fiat currencies. The growth in the stablecoin market during this BTC bear market means that a lot more capital can be quickly deployed into BTC during the next bull market.
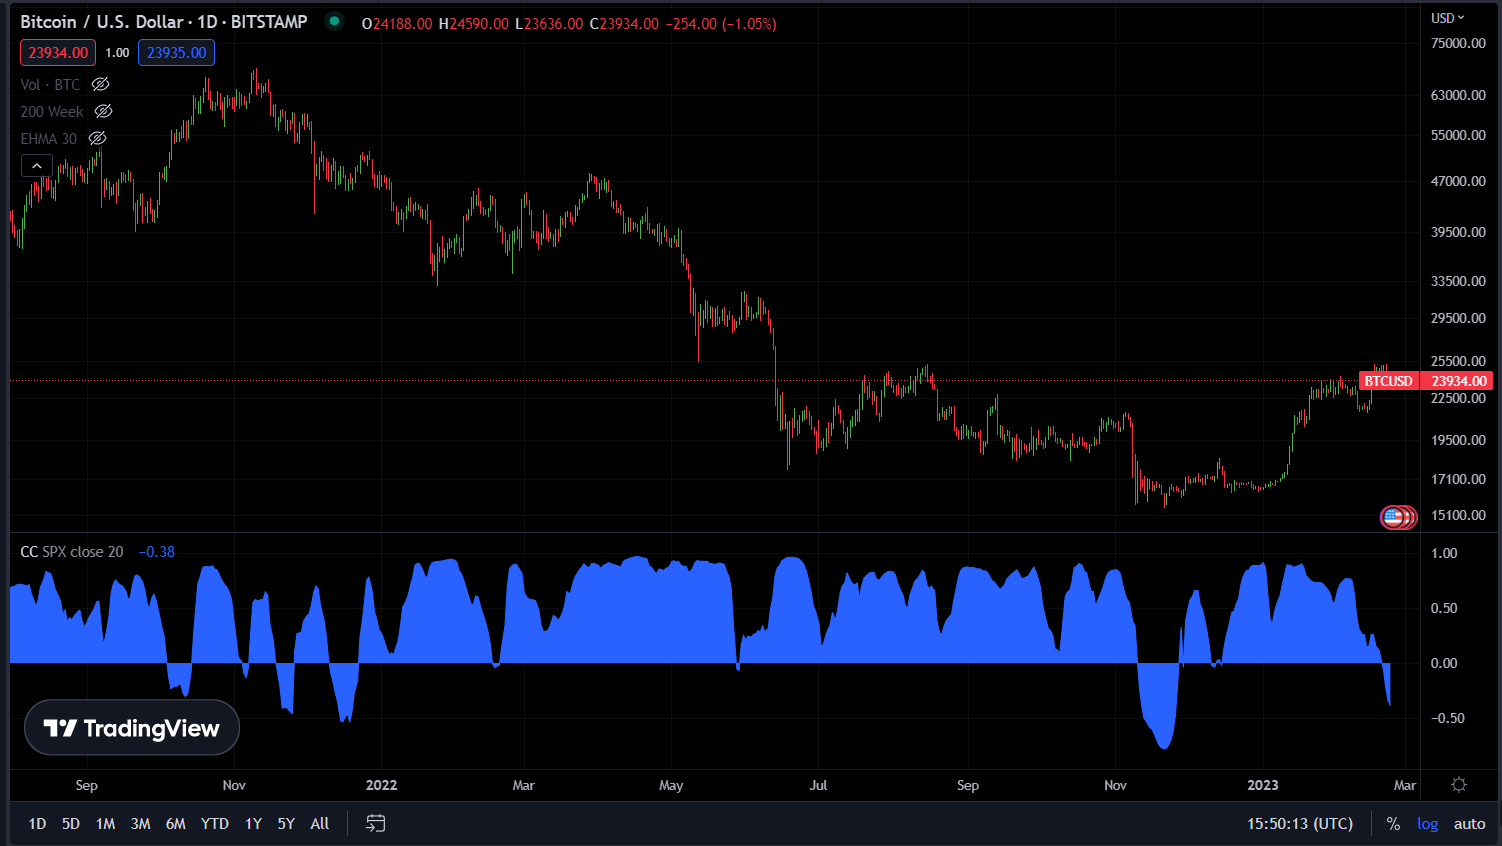
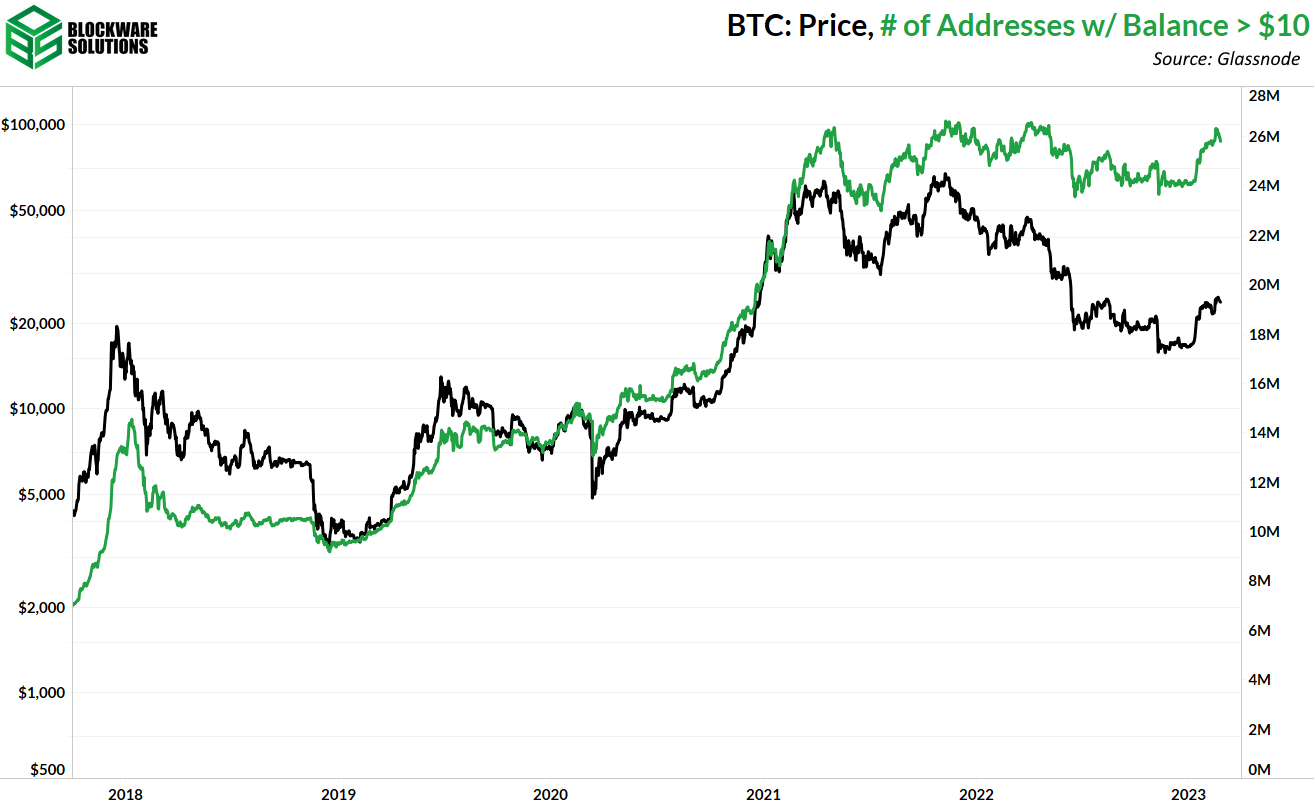
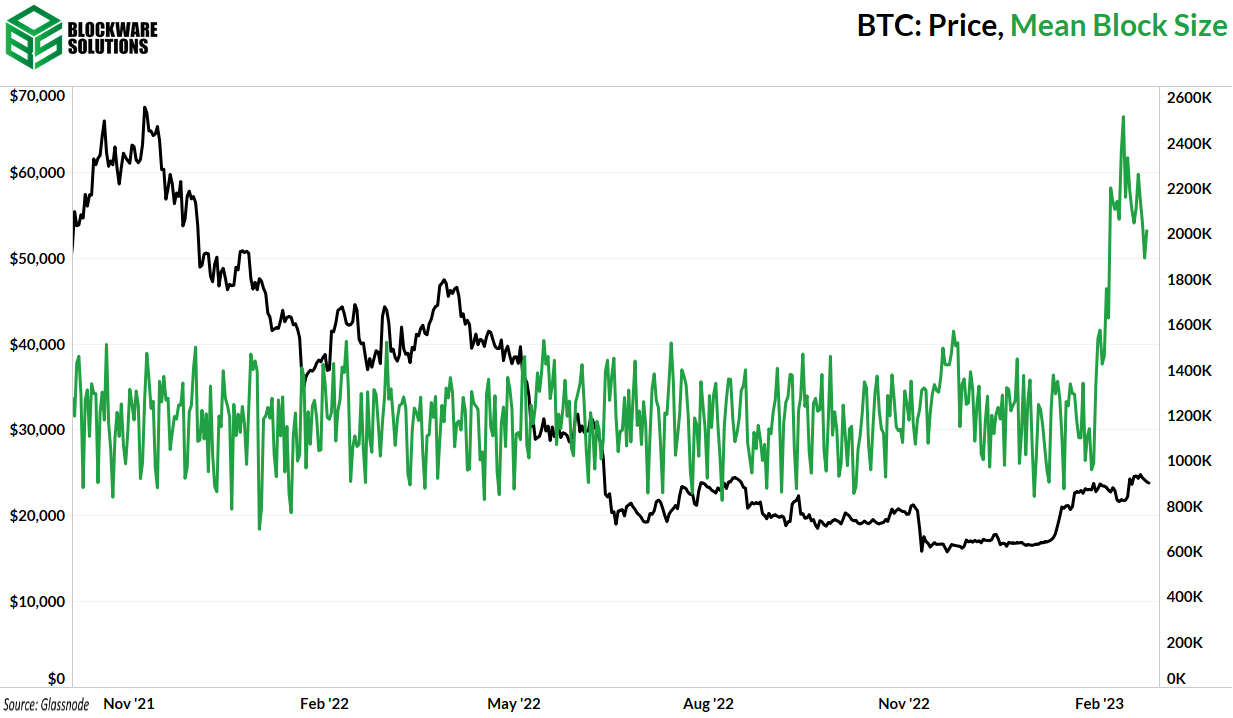
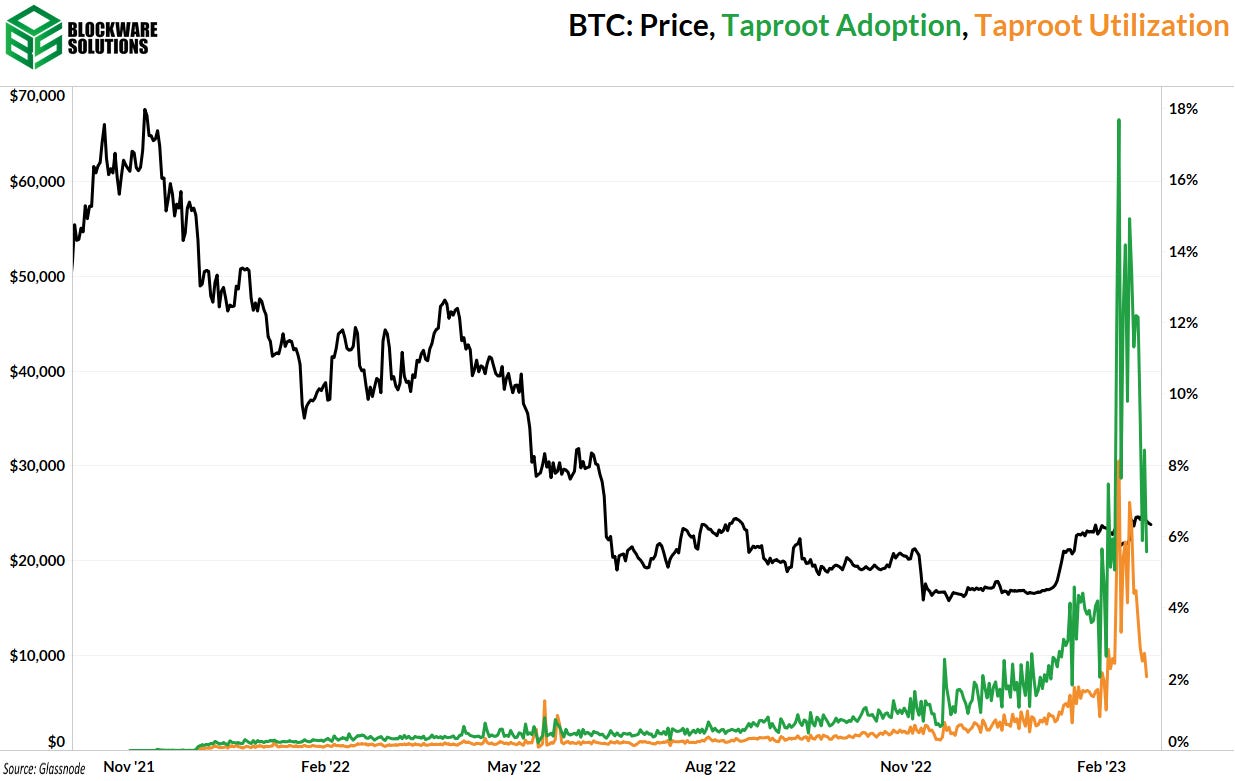
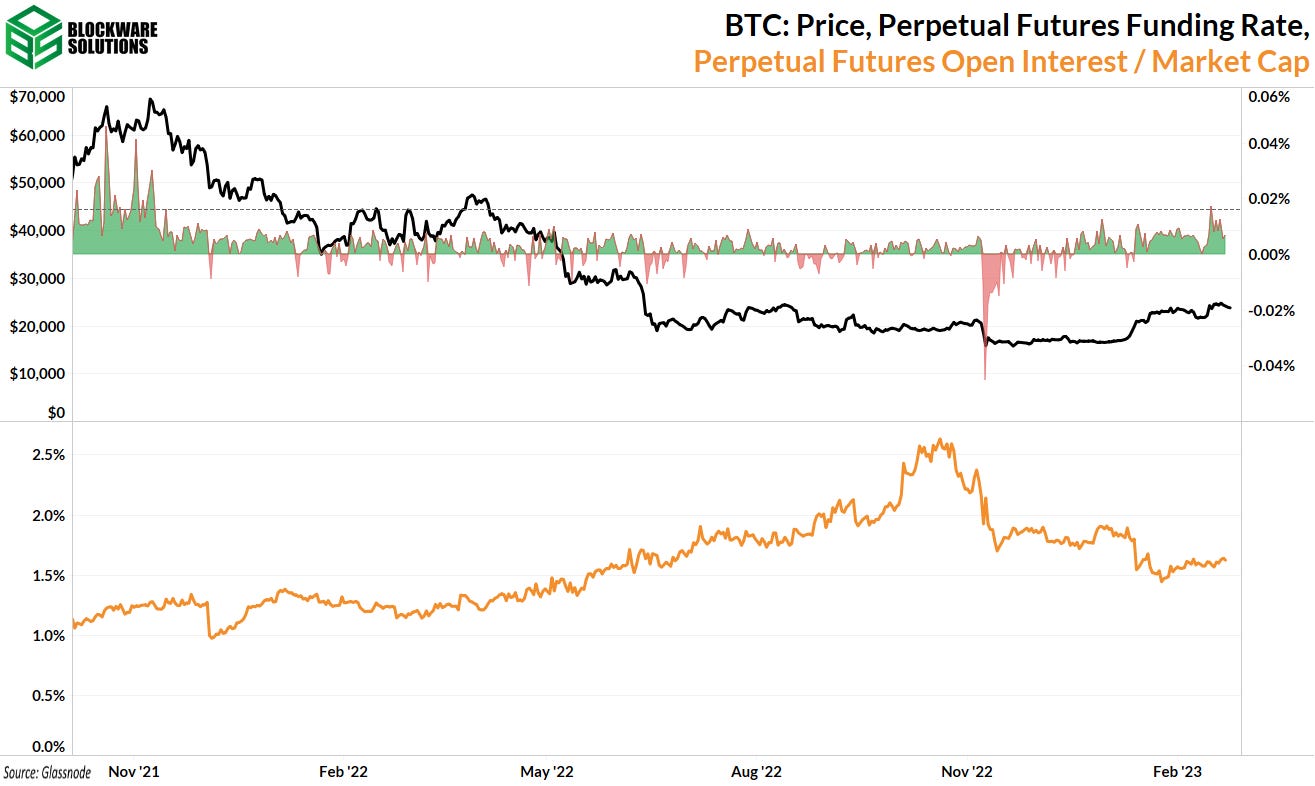
The correlation between Bitcoin and the S&P 500 has flipped negative. This is the first instance of a strong negative correlation between these two assets since the FTX implosion. Prior to that, the last instance was during the height of the bull run. Much of the uncertainty around whether or not the price of BTC will go back down is due to the gloomy macro environment and the fear of a macro-induced black swan event. While this is a very short-term negative correlation, and likely not yet anything to celebrate, it is worth noting as Bitcoin has been trading hand-in-hand with risk assets. Bitcoin will not trade alongside risk assets forever as it is the ultimate risk-OFF asset. Absolutely scarce, zero counterparty risk, salable across time, space, scales, etc. The chart below I want to show not because it can provide any short-term signal, but because it shows the adoption that has been going on during this bear market. Despite price being down ~63% from its peak, the number of addresses containing > $10 worth of BTC is basically at an all-time high; clocking in at nearly 26,000,000 different addresses. During previous bear markets, as the price went down so did this metric. Now, the rate of BTC adoption is accelerating and a greater number of people are getting off of zero. During the rise in popularity of ordinals/inscriptions we saw a significant increase in the average block size. However, it is likely that this was a temporary fad as the average block size appears to have peaked and is slowly reverting back to normal. Looking at the degree of taproot adoption and utilization also supports the idea that inscriptions were a fad. It’ll be interesting to see if inscriptions make a resurgence in future bull markets as new waves of speculators arrive. What is likely to happen is that taproot adoption/utilization will return to it’s original trend of a gradual increase as taproot use cases beyond inscriptions will be developed. There have been no major changes in the derivatives market. The funding rate is still positive, although it has declined slightly as the price moves sideways. Open interest relative to market cap is accumulating, which, as we have noted in previous newsletters, tends to occur during sideways price action as fewer shorts and longs are liquidated. Bitcoin Mining
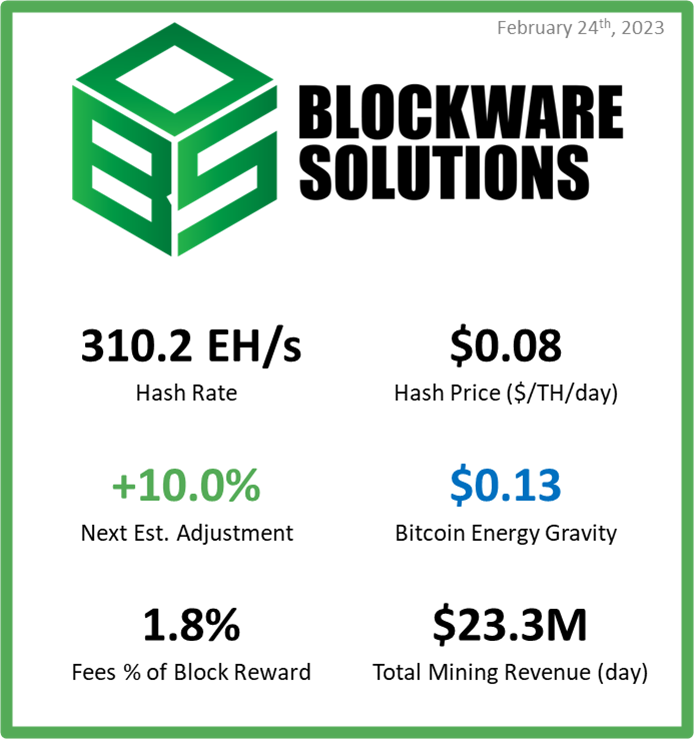
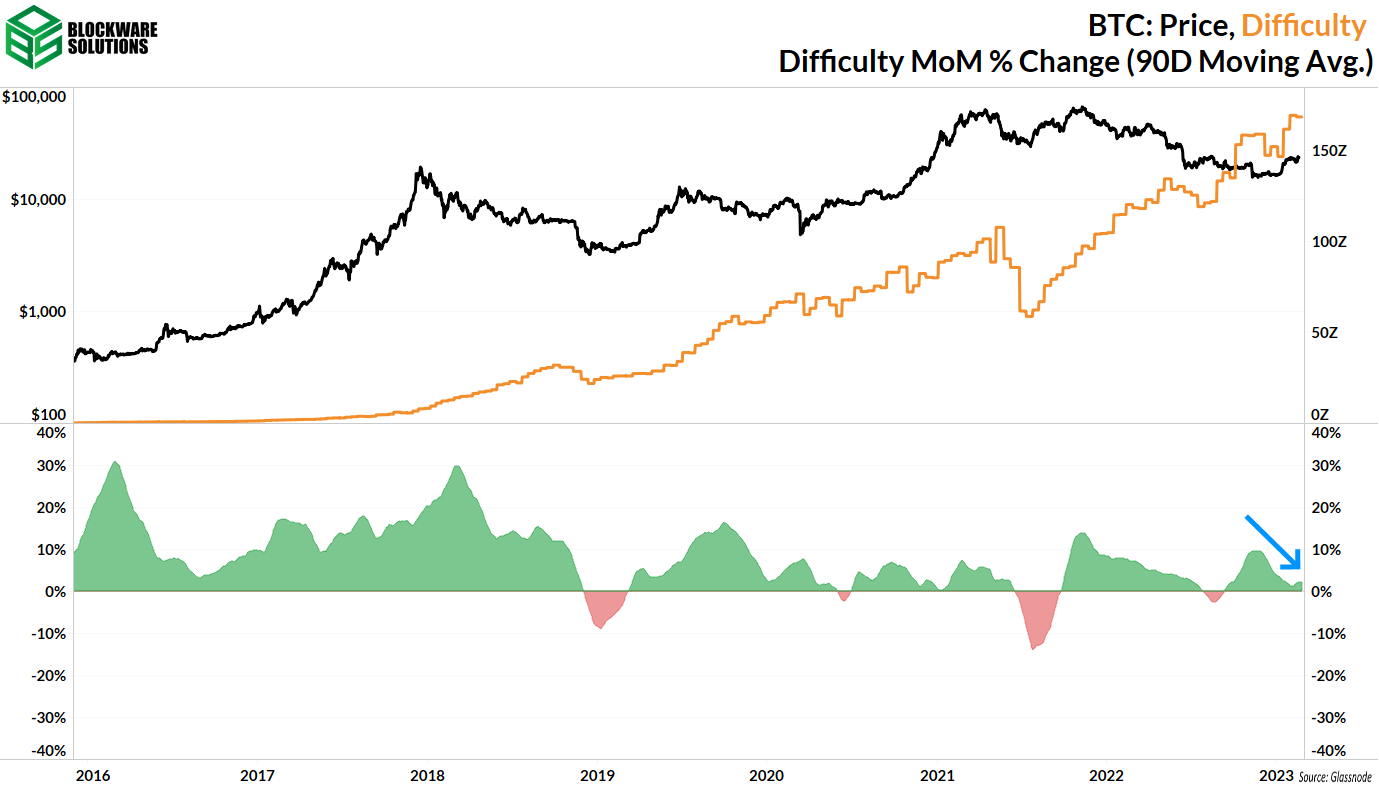
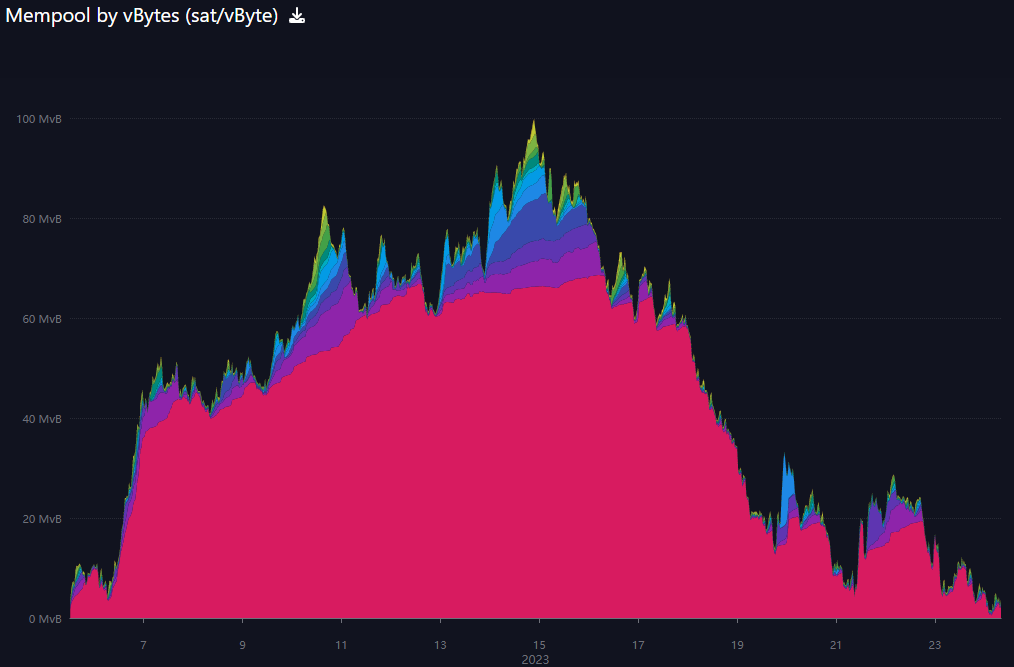
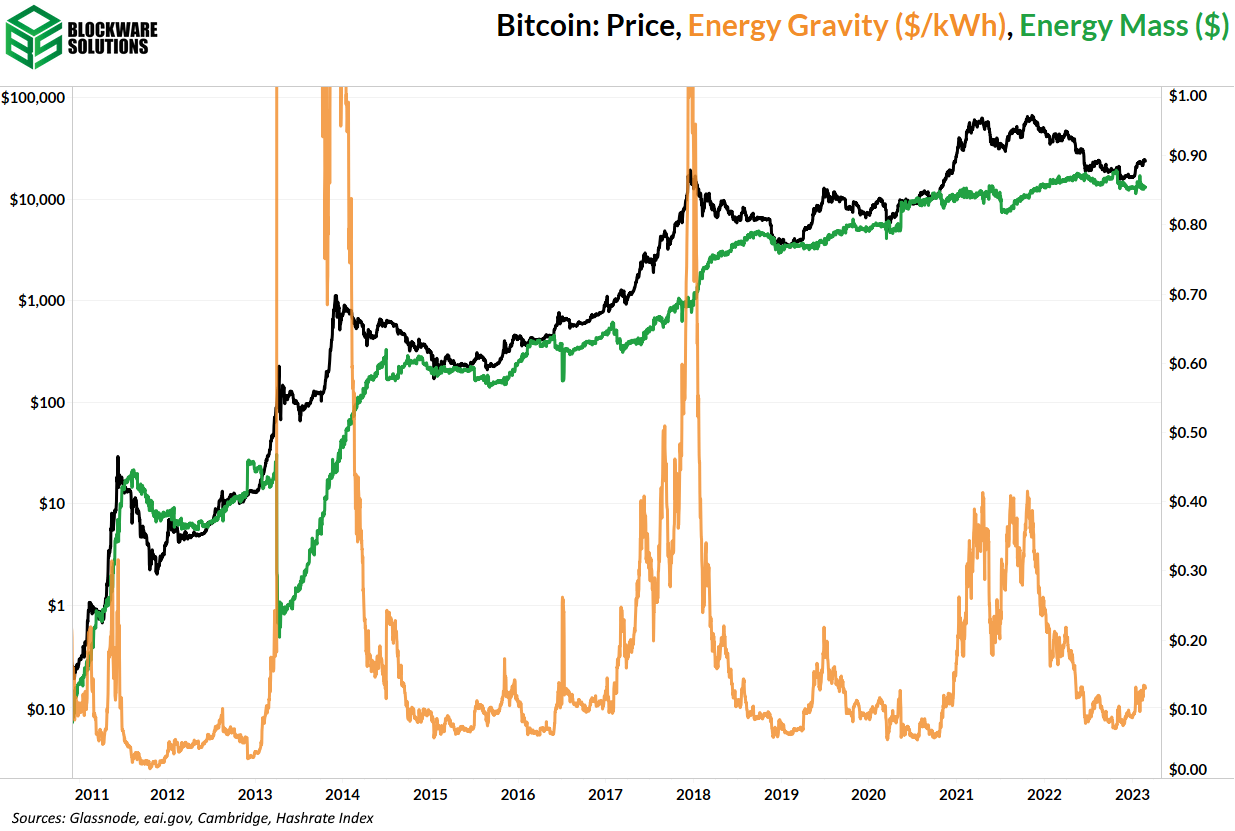
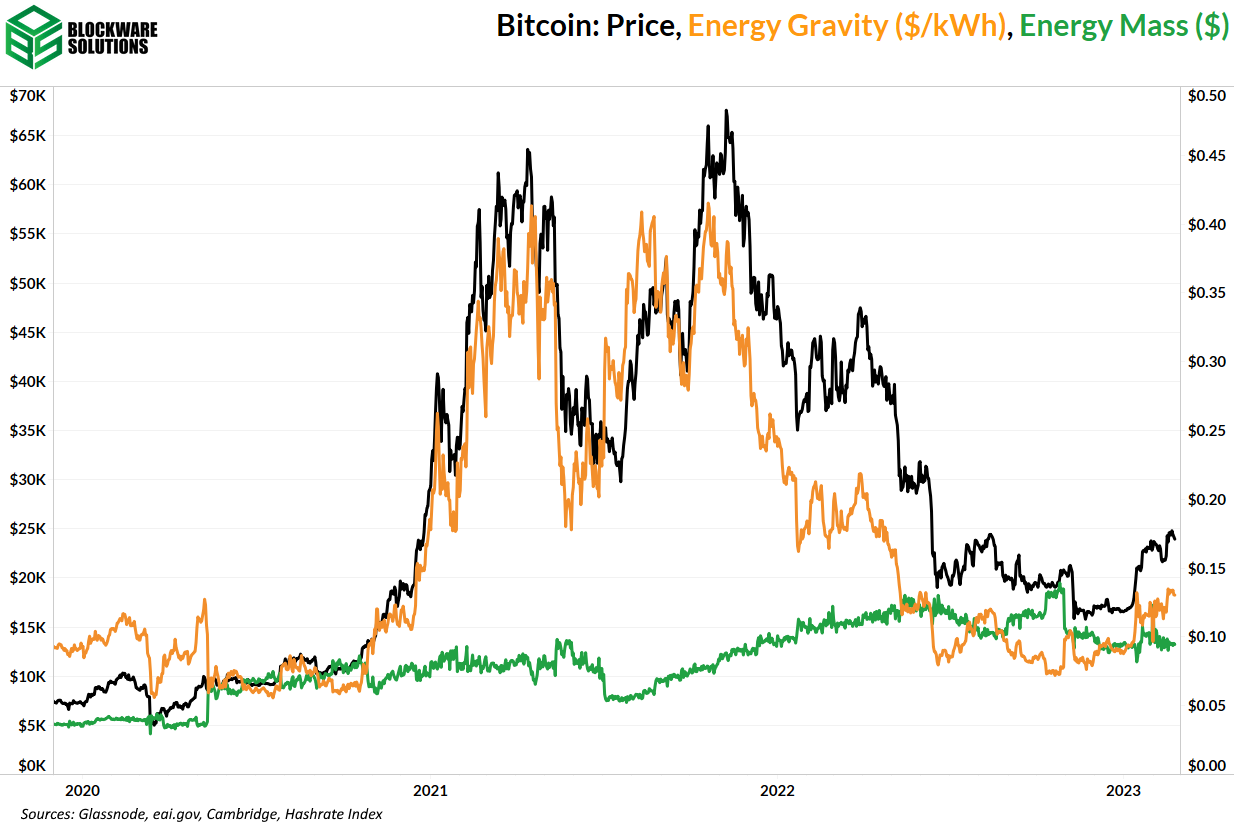
Unfortunately for Bitcoin miners, mining difficulty is projected to adjust significantly upwards. As mining difficulty increases, Bitcoin miners earn less BTC for the same amount of hashrate they provide. While we continue to expect the growth rate of mining difficulty to be slower than in previous years, there are a few potential reasons why we are seeing a significant increase in difficulty today. 1. Newly manufactured XPs and J Pro+s are getting plugged in. 2. Winter is ending, global energy prices are retreating, and curtailment is occurring less. Even with this upcoming sharp difficulty increase, the MoM growth rate will likely not surpass previous highs, and our thesis of slower difficulty growth will likely remain intact. Mempool May Clear Soon The Bitcoin Mempool is where pending Bitcoin transactions wait to be included in a block. The mempool appears to have not cleared since February 5th, which was 19 days ago. A big chunk of the cheap transactions that piled up in the mempool were ordinal transactions storing data on the blockchain. Currently, the hype around ordinals appears to be fading away. Energy Gravity The following charts are based on a previous Blockware Intelligence Report that models the relationship between Bitcoin’s price and its production cost. The model makes it easy to visualize when the price of Bitcoin is overheated or bottoming. All content is for informational purposes only. This Blockware Intelligence Newsletter is of general nature and does consider or address any individual circumstances and is not investment advice, nor should it be construed in any way as tax, accounting, legal, business, financial or regulatory advice. You should seek independent legal and financial advice, including advice as to tax consequences, before making any investment decision. Blockware Intelligence Newsletter is free today. But if you enjoyed this post, you can tell Blockware Intelligence Newsletter that their writing is valuable by pledging a future subscription. You won’t be charged unless they enable payments.
Read Blockware Intelligence Newsletter in the app
Listen to posts, join subscriber chats, and never miss an update from Blockware Intelligence.
© 2023 Blockware Solutions |

