Blockware Intelligence Newsletter: Week 77
Blockware Intelligence Newsletter: Week 77Bitcoin on-chain analysis, mining analysis, macro analysis; overview of 2/25/23-3/3/23
Blockware Intelligence Sponsors If you are interested in sponsoring Blockware Intelligence email: sponsor@blockwaresolutions.com.
Bitcoin Mining 101 We are proud to release our newest report: Bitcoin Mining 101. Co-published with the Satoshi Action Fund, a non-profit dedicated to educating policy-makers and regulators on the importance of Bitcoin Mining, this report is designed to educate on the fundamentals of Bitcoin and Bitcoin mining. Special thanks to everyone on the Blockware Intelligence Team, Dennis Porter & the Satoshi Action Fund, and Mitch Klee & Foreman Mining for their contributions to this report. We hope this serves as a valuable educational tool! Check it out here: https://blockwaresolutions.com/s/Mining-101-Blockware-Intelligence.pdf Summary
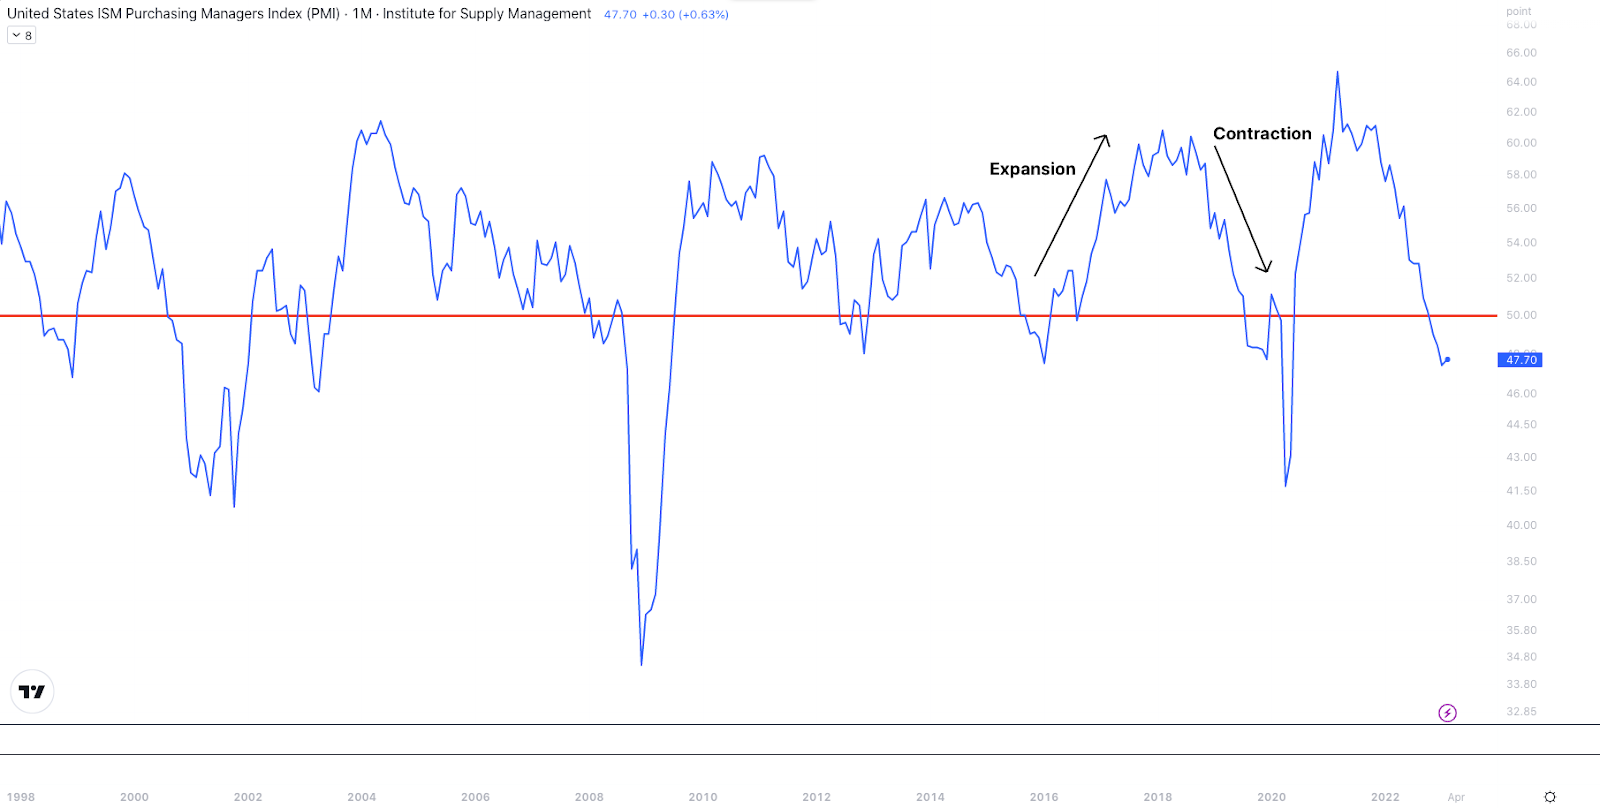
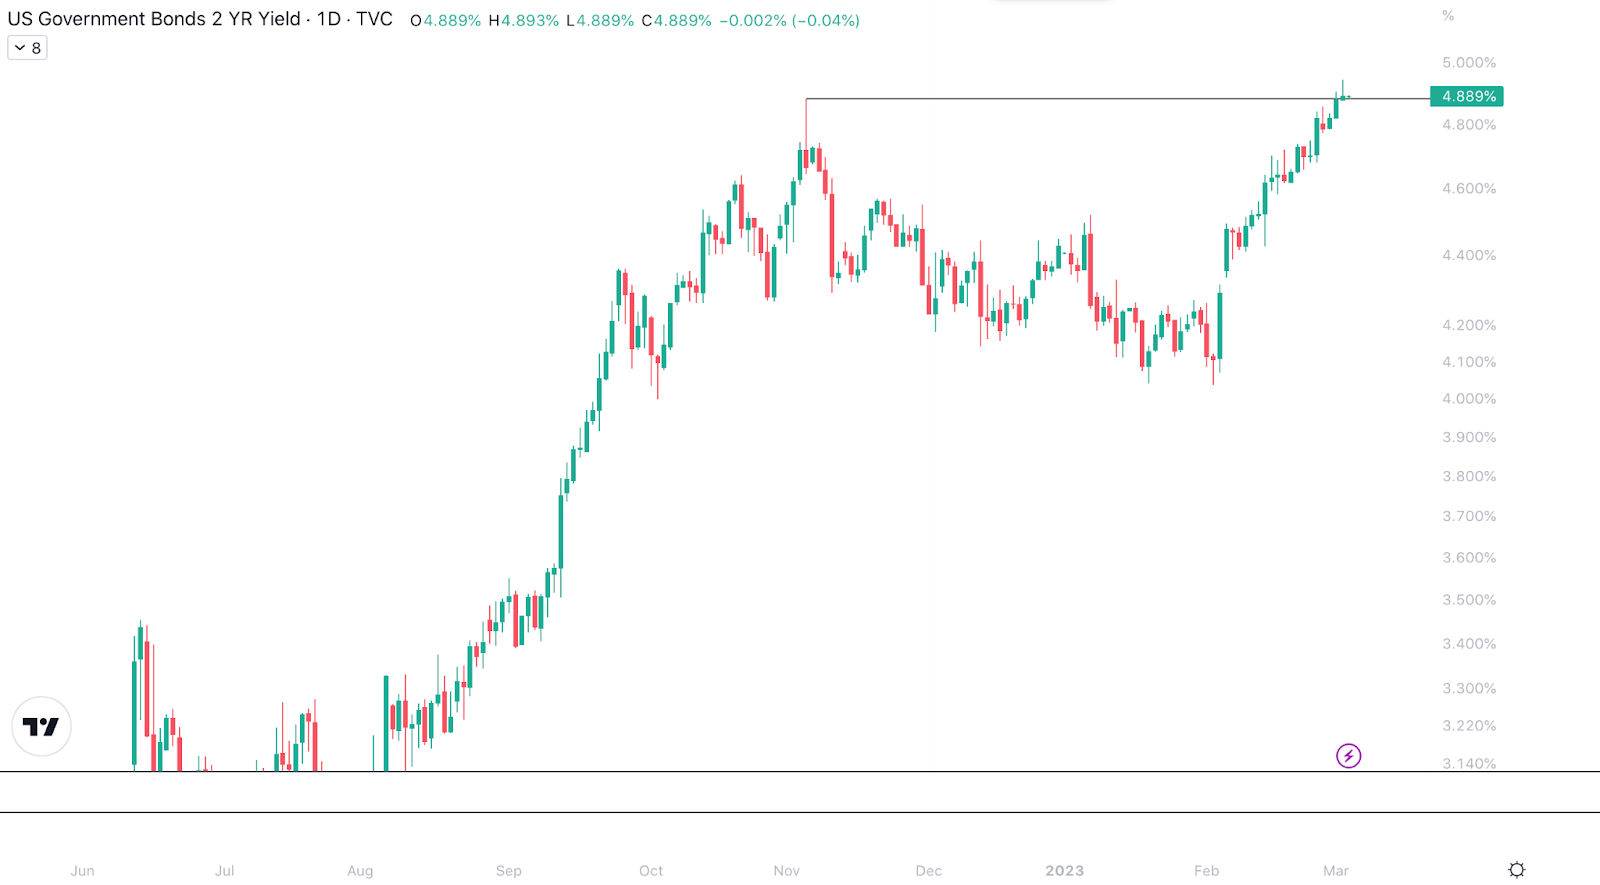
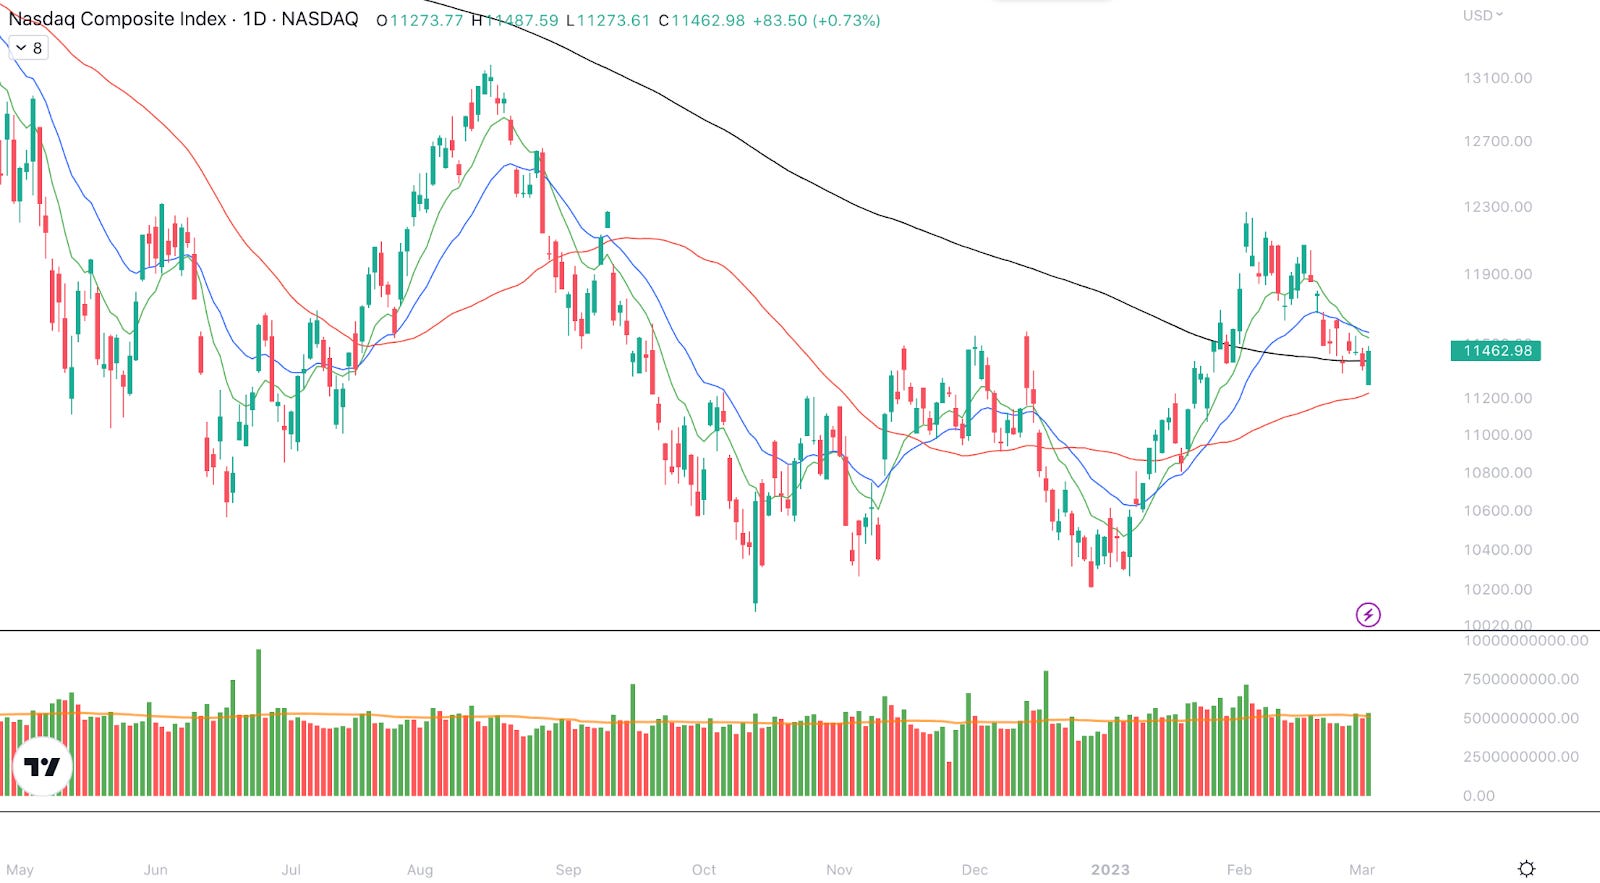
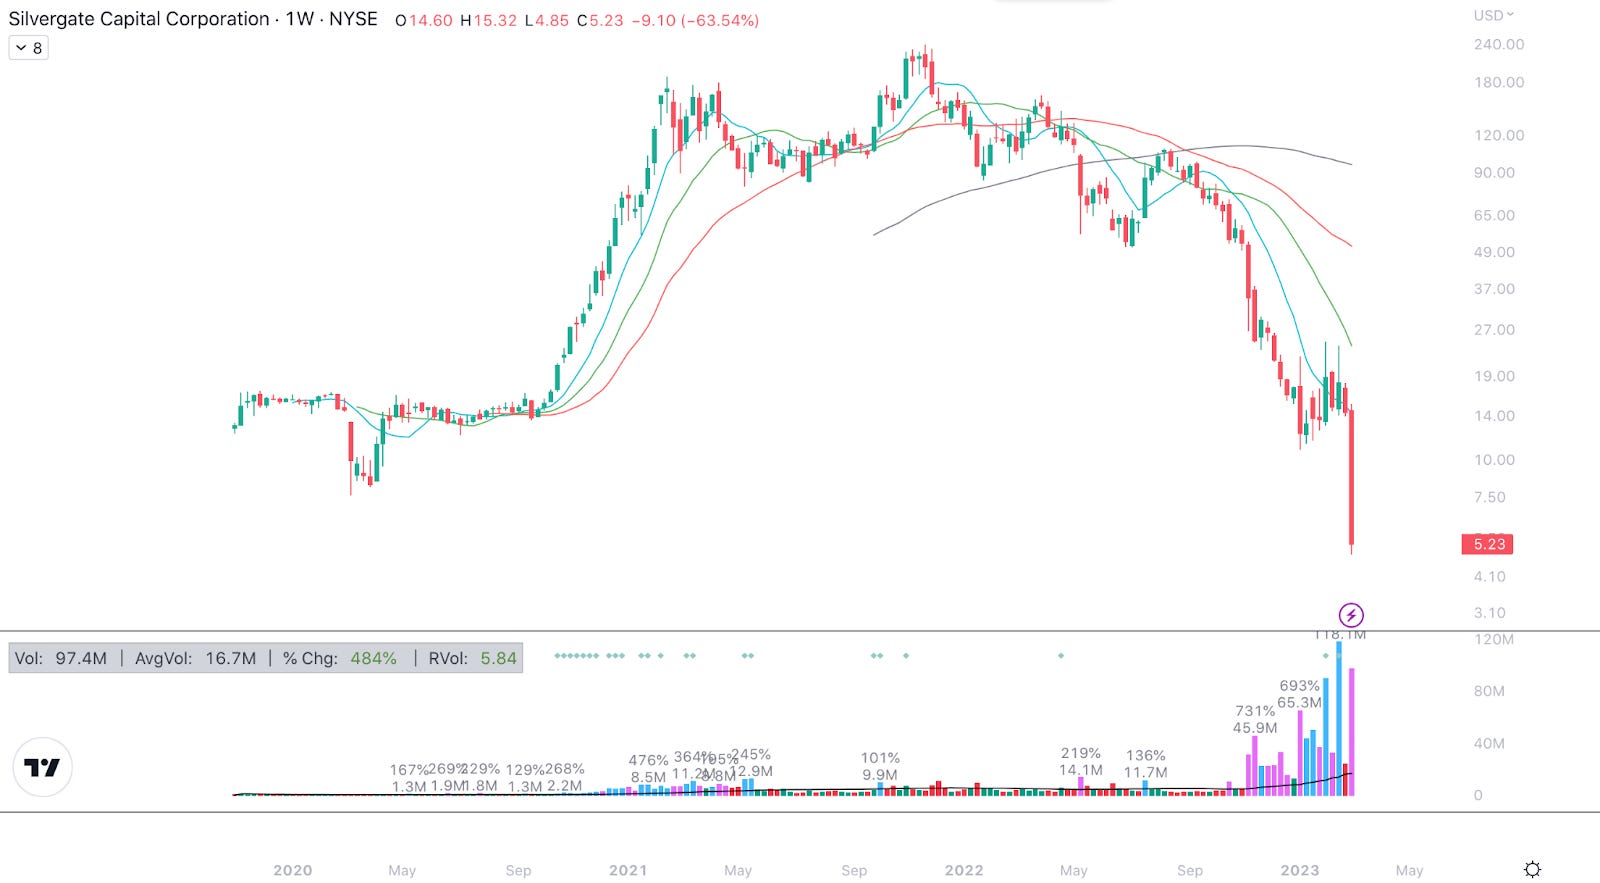
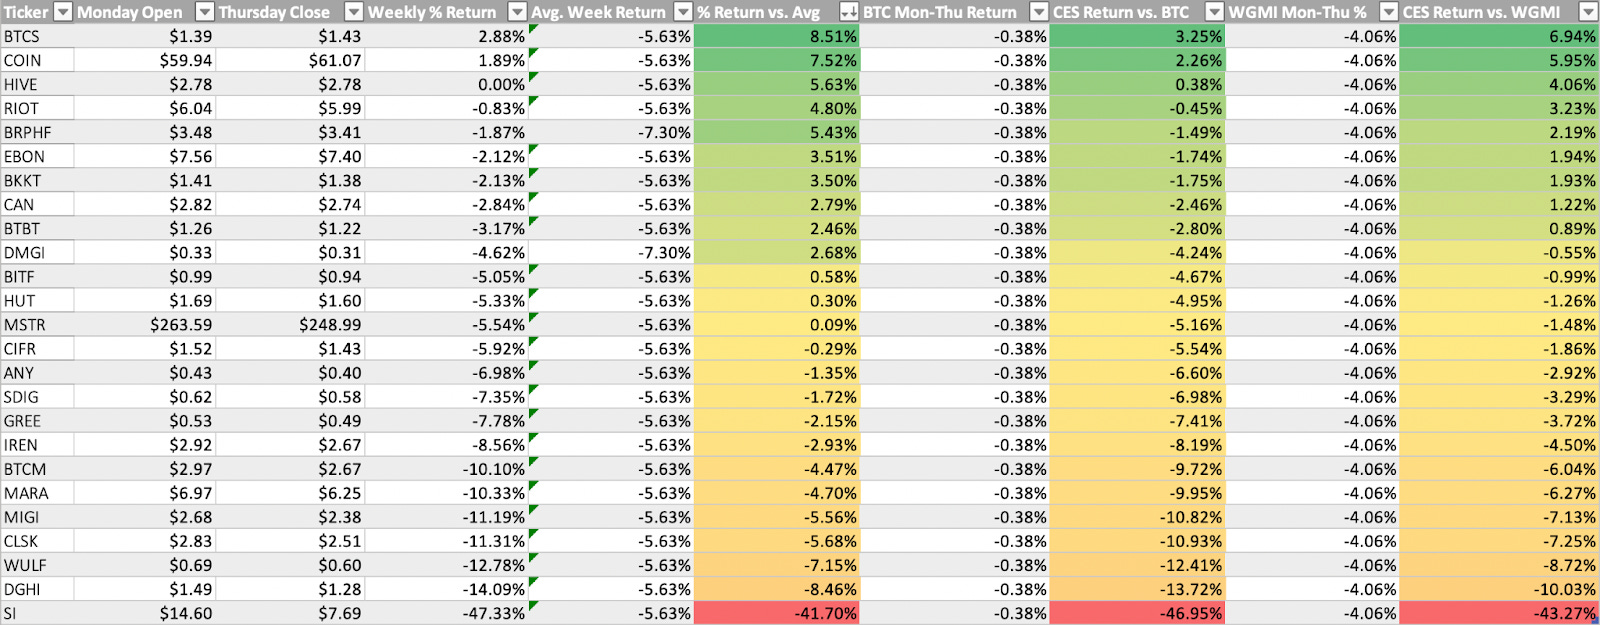
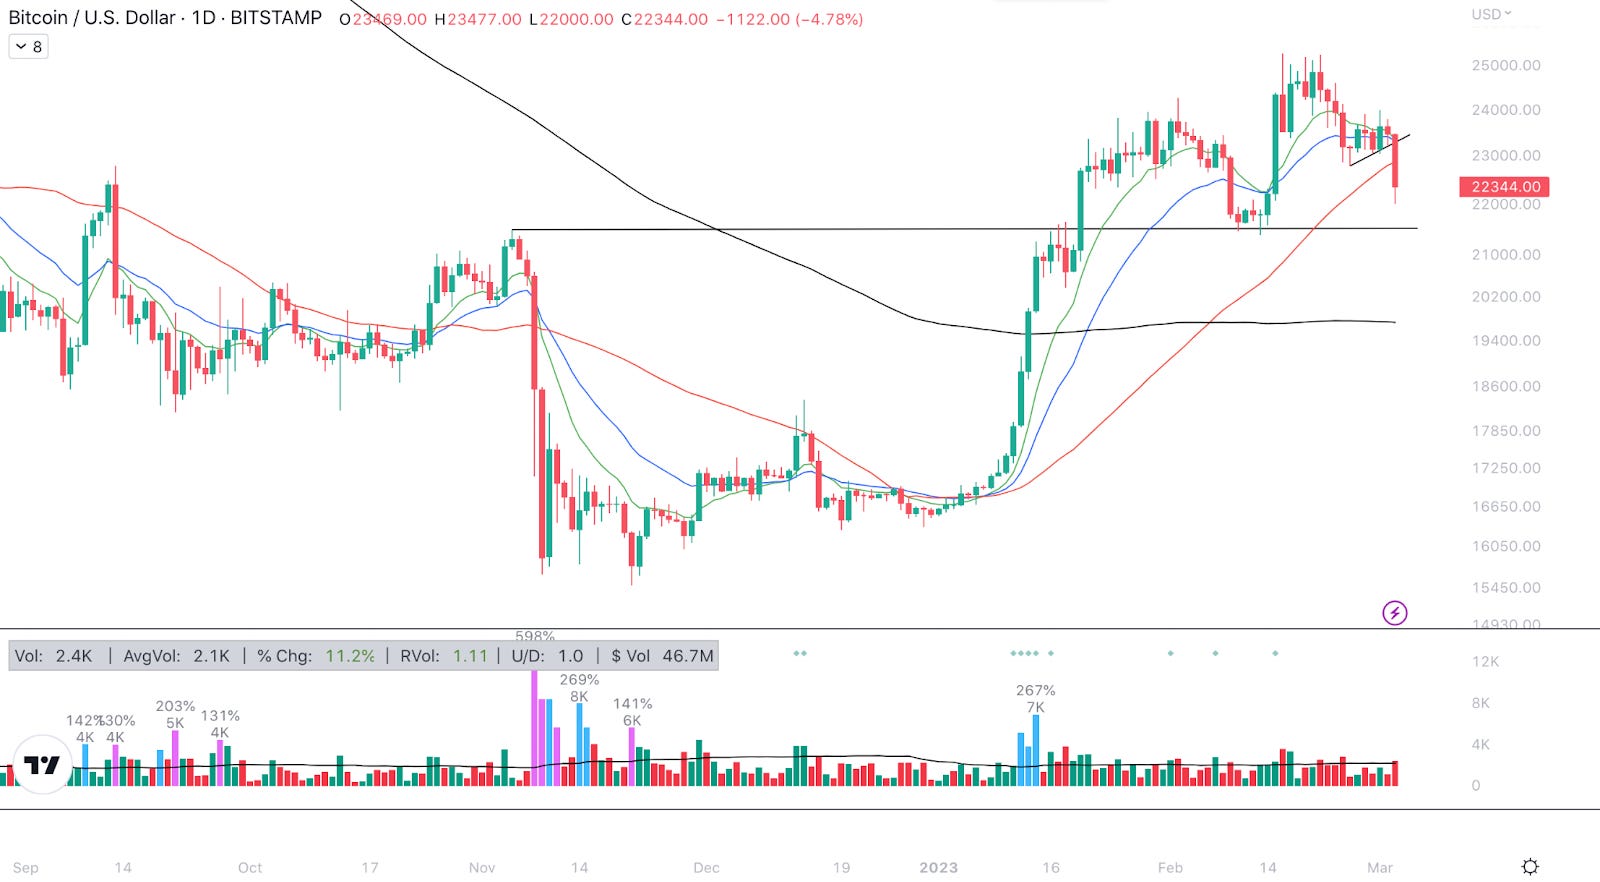
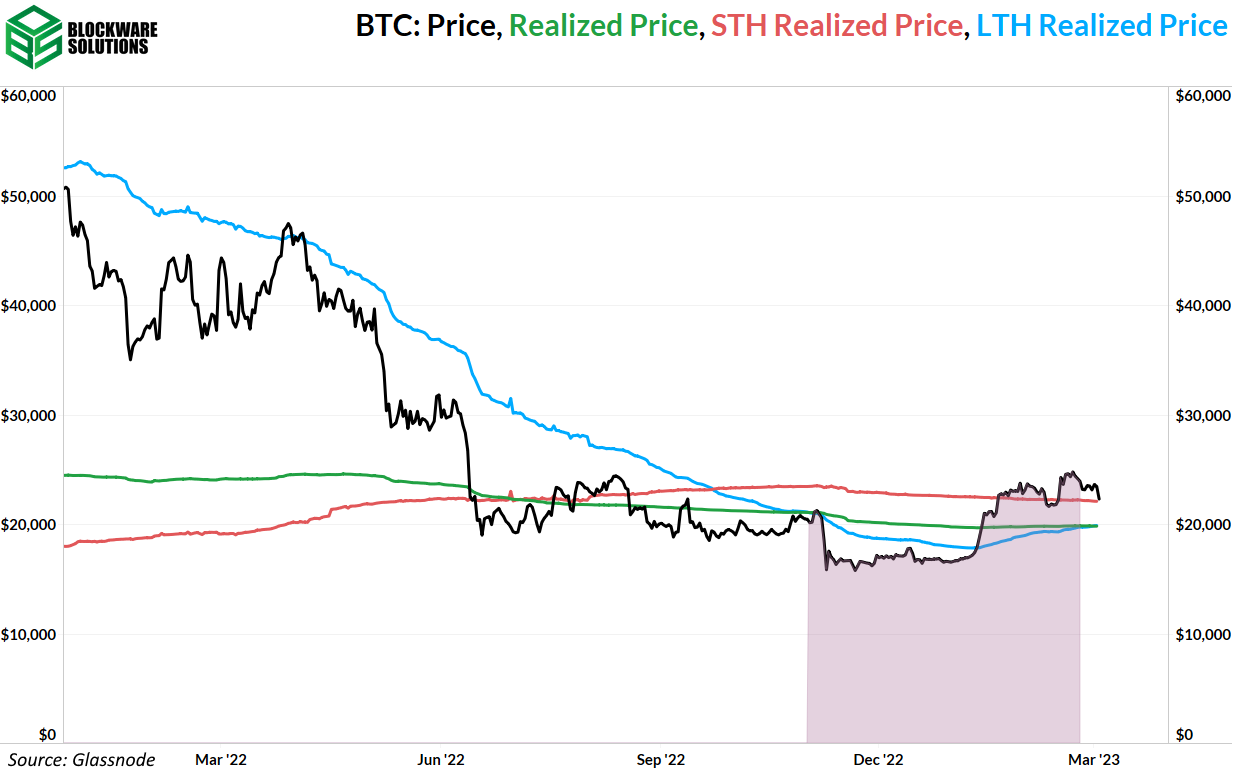
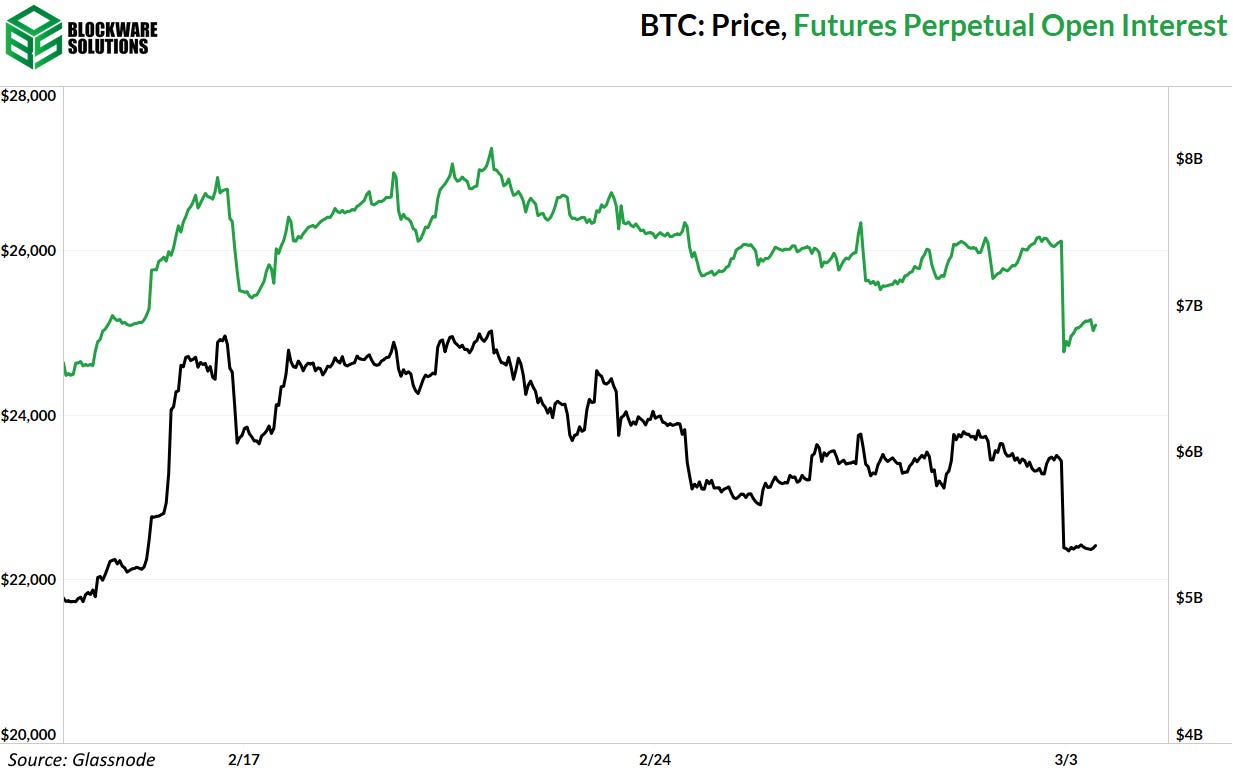
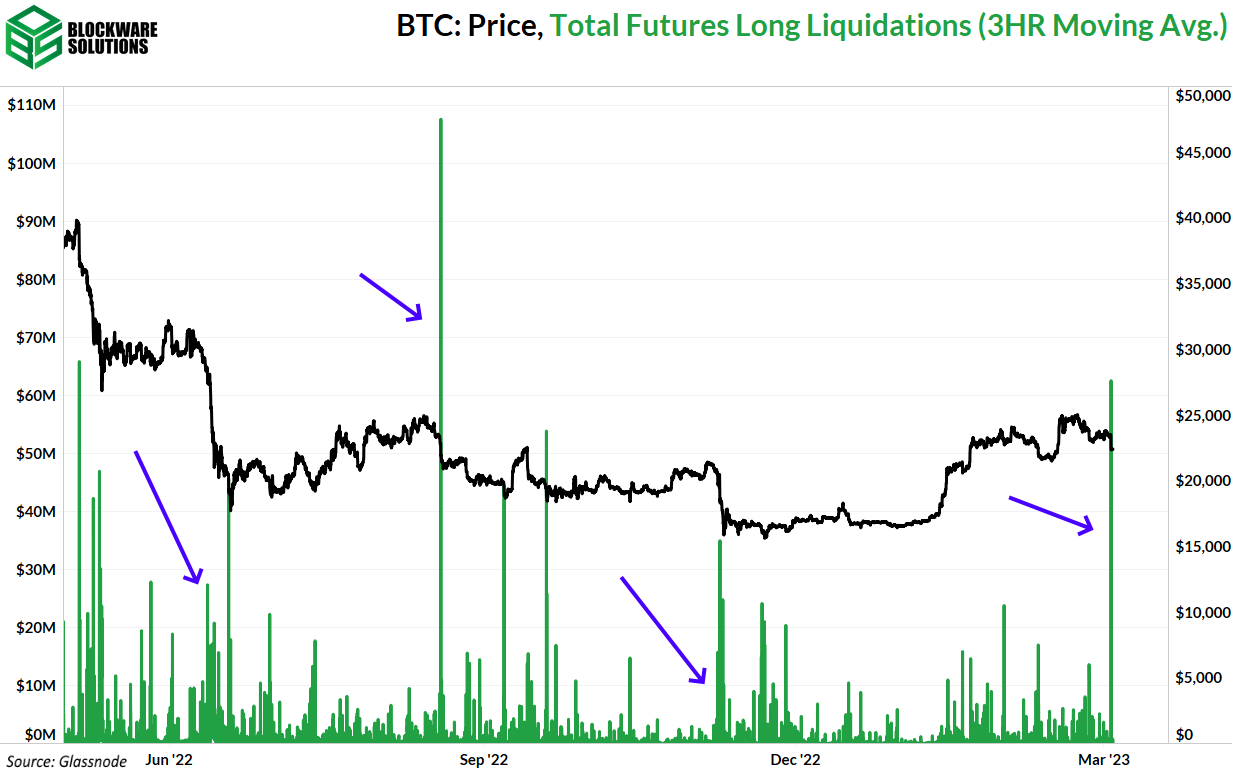
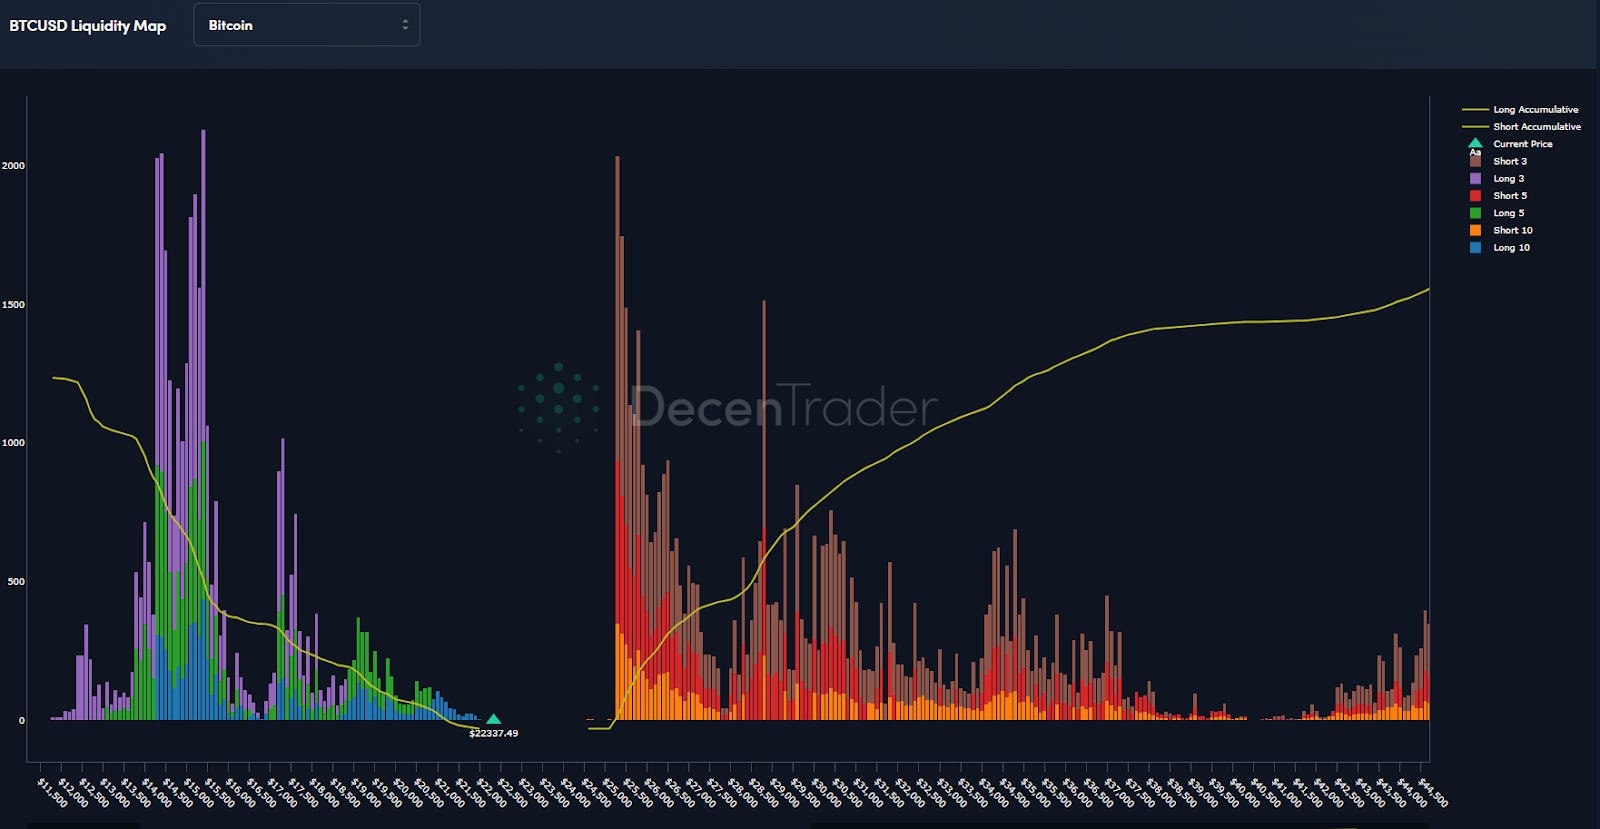
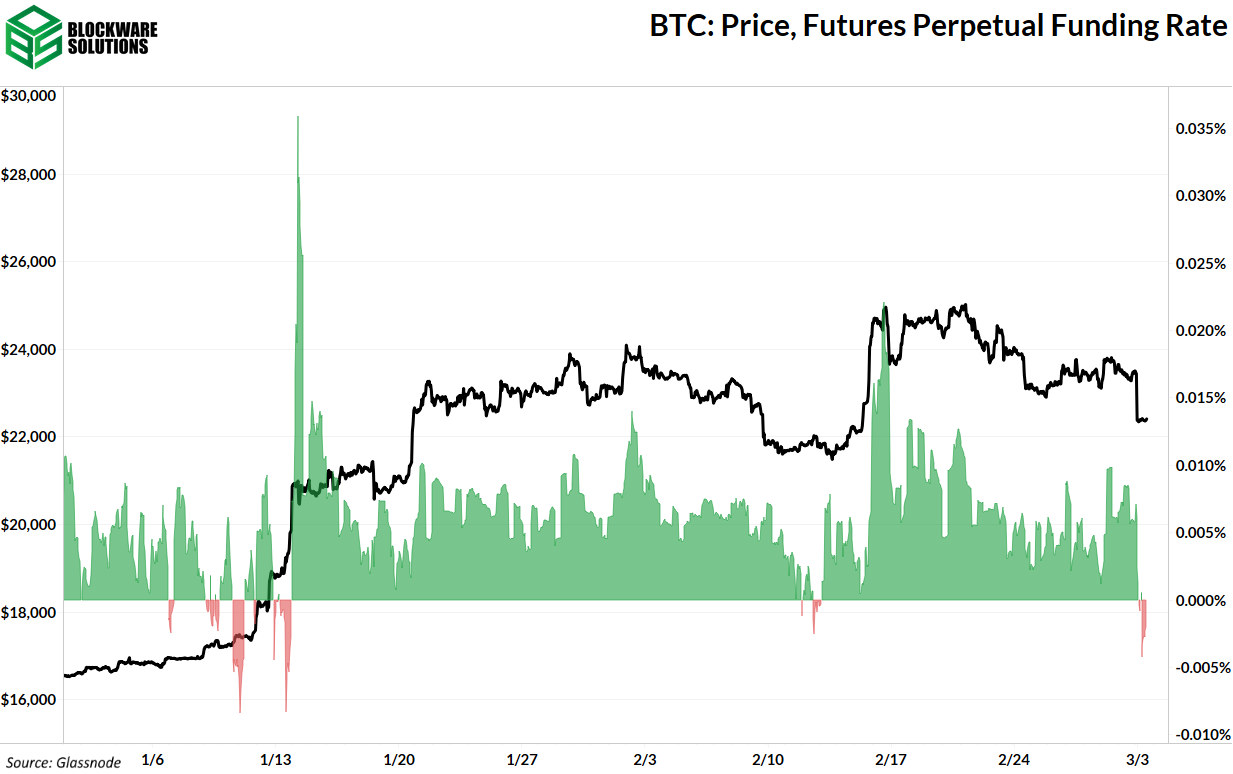
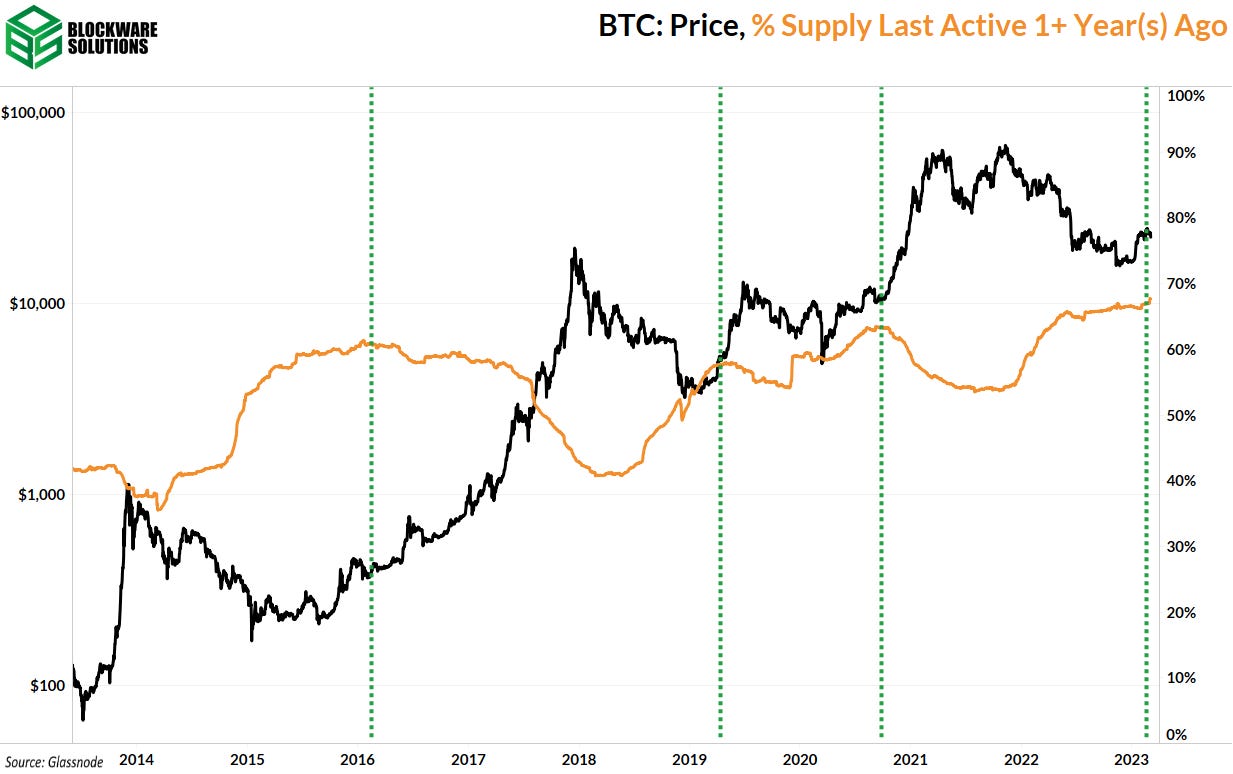
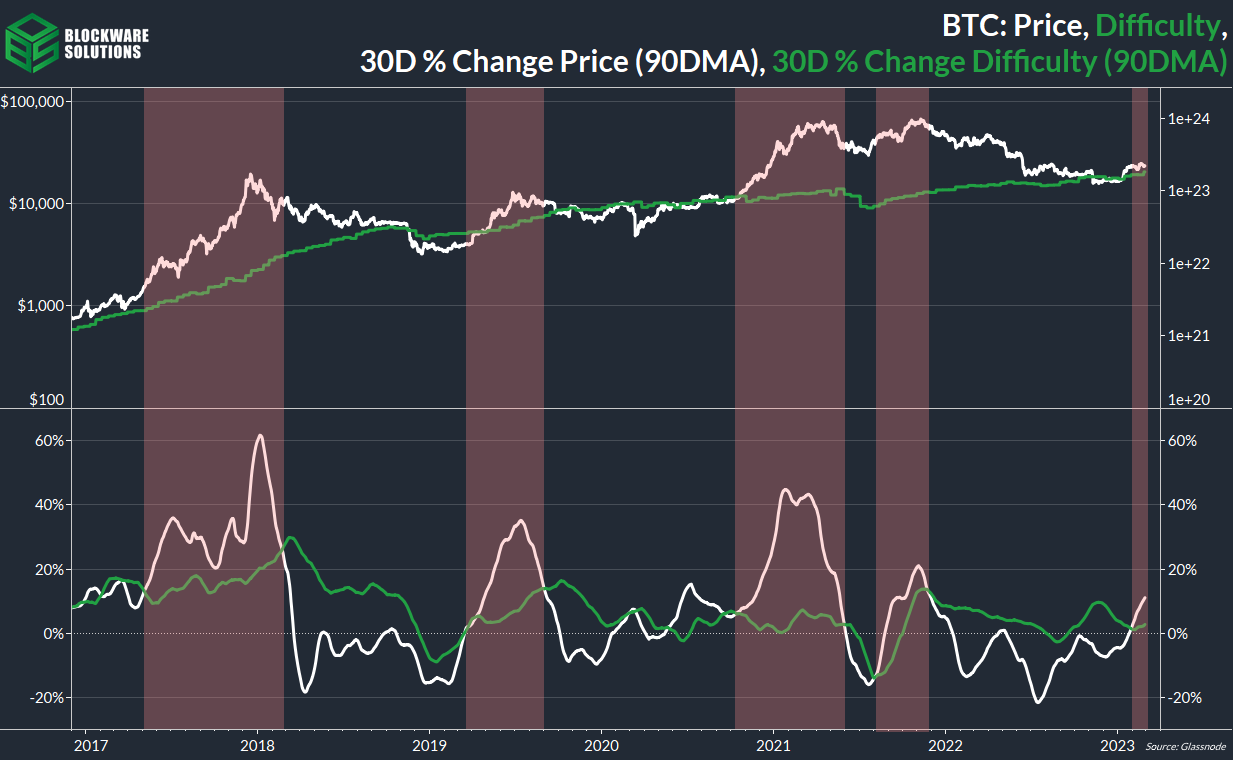
General Market Update Following last week’s craziness, it’s been a quieter week across the markets. The biggest economic data release came on Wednesday with the Institute of Supply Management (ISM) sharing February’s Purchasing Managers Index (PMI). ISM surveys manufacturing managers and asks them to rate the current market environment (is it growing, stagnant or shrinking). As we’ve discussed in this newsletter many times, PMI gives us a historically accurate indication of what stage of the economic cycle we’re in. Generally, PMI follows liquidity cycles. When more liquidity is in the system, demand is usually more robust and thus, manufacturers are likely bullish on the market. The cycle of PMI rising and falling every ~2-5 years is a strong indicator of the Short-Term Debt Cycle, also known as the Business Cycle. ISM Manufacturing Purchasing Managers Index, 1M (Tradingview) As you can see above, February’s manufacturing PMI came in at 47.7%. Although this was up from January’s 47.4%, February marked the 4th straight month of contraction (<50%) following 28 straight months of growth. The horizontal red line above shows 50.0%, the benchmark used to signal if the PMI is expanding or contracting. While it is possible that the contraction is easing, it’s more likely that we are seeing a short-term uptick as seen numerous times in past contraction cycles. As interest rates continue to rise, it’s likely that we see the PMI continue to fall. In the land of yields, we’ve thus far seen another week of selling in the Treasury market. Last week we discussed how the 2-year yield was likely to make new cycle-highs and likely surpass 5% eventually. US 2-Year Treasury Yield, 1D (Tradingview) On Wednesday, the 2-year’s yield broke above the November high of 4.881%. On Thursday, the 2Y continued to sell off, hitting a high of 4.944% yield. Furthermore, the 10-year’s yield surpassed 4% on Wednesday for the first time since November. This is a function of an idea that Blockware Intelligence has been discussing for months. The economy is not cooling down at the pace the Fed had hoped, and now the market is pricing in higher future interest rates. Nasdaq Composite Index, 1D (Tradingview) As you can see above, the Nasdaq has largely traded sideways this week. On Friday and Wednesday, the Nasdaq found buyers at its 200-day simple moving average. The gap-down on Thursday finally brought the index below this key moving average, but buy strength ultimately led to the Nasdaq closing back above its 200-day. After finding support around the 50-day, price action appears fairly strong as of Friday morning. It appears that the market is largely waiting on new economic data in order to make decisions. Across the last several sessions we’ve seen strength get sold, and weakness get bought. Keep in mind that next Friday (March 10), the Jobs Report for February is set to be released. This is usually a large market moving data point, but we will discuss it more in next week’s edition of the Blockware Intelligence newsletter. Crypto-Exposed Equities Overall, we’ve seen much of the same sideways/down price action from Crypto-Equities that this newsletter has discussed for the last several weeks. With Bitcoin breaking down on Friday, it isn’t a surprise to see several names following suit. On the fundamental side, several public miners released their February production updates this week. Mawson Infrastructure Group (MIGI) announced that they are expanding their Pennsylvania facility to 120MW. This new energy capacity is expected to be operational in Q2 2023. CleanSpark (CLSK) hit a new peak efficiency of 30.6 W/Th. They are still waiting for an additional 50MW to come online and to take delivery of their 20,000 S19j Pro+ order from Bitmain. Cipher (CIFR) brought an additional 0.9 EH/s online, allowing them to hit an all-time high of 5.2 EH/s across their facilities. Growth in network hashrate has been fairly robust this bear cycle. In our opinion, it’s hard not to be bullish on Bitcoin in the long-term when you see the unrelenting expansion underway from public miners. In non-mining news, Coinbase (COIN) cut ties with Silvergate (SI) bank. Coinbase wasn’t alone, Paxos, Galaxy Digital, Gemini, BitStamp, and Circle all also announced that they were moving elsewhere for their banking partner. Silvergate Capital, 1W (Tradingview) The weekly chart of SI above should tell you just about all you need to know. SI is the #2 most shorted stock in the entire market, and is down 70% YTD and ~98% from it’s all-time high of $239.26. Silvergate’s lack of liquidity and severe risk of insolvency is something that has been discussed for months. Between several large companies cutting their ties, and SI announcing on Thursday that they will be unable to release their 2022 annual report by their March 16th deadline, it seems all but confirmed. As always, the table above compares the Monday-Thursday performance of several crypto-equities. Bitcoin Technical Analysis On Thursday afternoon we were planning to explain how the price structure of Bitcoin pointed towards lower prices in the near-term. By Friday morning, this has already begun to play out. Bitcoin/US Dollar, 1D (Tradingview) Price has now broken below the 50-day SMA (red line above) for the first time since early-January. Obviously, we would like to see price reverse higher to close above the 50-day at $22,865. While this current price structure does indicate lower prices to come in the short-term, Bitcoin has shown fairly robust bidding in recent weeks. With the equity indexes moving lower over the last couple weeks, seeing BTC hovering around ~$23,500 showed us that Bitcoin bulls are still unrelenting. Furthermore, the equity indexes appear fairly strong as of Friday morning. However, this could all change very quickly if bid prices get pushed lower and shorts re-enter the market. Heading into the weekend, if BTC is not able to reverse back higher, we are eyeing $21,500 as the most likely support zone. Bitcoin On-chain and Derivatives Sentiment on twitter amongst both the Bitcoin and macro communities has certainly been rattled over the past few weeks, given the increased likelihood of the Fed staying true to “higher for longer.” On Thursday, BTC declined ~5% against the dollar. However, the year-to-date gains still remain very much intact. Short-term holder realized price, which currently sits just below $20,000, is the most important on-chain support level at this time. This metric finally crossed above realized price; something that we have been looking for over the past couple of weeks. This has historically been an accurate signal of bear market bottoms. Typically we look at derivatives at the end of the on-chain section, but this recent wick down has been driving by de-leveraging, so let’s discuss derivatives first. Futures open interest dropped by nearly $800m in the span of an hour, indicating that a liquidation cascade was triggered. This was the first significant liquidation of longs since the FTX implosion that occurred nearly four months ago now. Looking at the hourly chart below, you can see that long liquidations around the FTX implosion and Celsius implosion form more of a cluster as the liquidations were happening over the course of multiple hours, as a consequence of the price going down due to capitulation; the liquidations themselves weren’t necessarily the entire reason price was going down. This time around, and the last time price pushed up against $25k resistance in August of last year, the hourly chart shows a single spike because the price decreased basically instantly; a true liquidation cascade. For the time being, the leverage in this range appears to have been cleared out. The next range of long liquidations begins below $22,000. There’s still a massive potential short-squeeze beginning at $25,300. That is the next major (short-term) milestone for the price of BTC. Funding rate has flipped negative. The previous regimes of negative funding all turned out very poorly for the bears. Were we to see a scenario in which price is dropping, longs are being liquidated, and the funding rate increasing, that would be bearish as it shows traders wanting to long into the liquidation cascade. Thankfully we saw the inverse. The bigger picture for on-chain has not changed. Specifically, the supply last active 1+ year(s) ago continues to soar to all-time highs; it now sits at over 67%. Of course, price is set based on marginal demand and marginal supply; ie. the 33% of supply that has moved in the past year. As such, price can move in any direction in the short-term. However, historically price tends to soar when a large percentage of the supply becomes inelastic. Continued relatively sideways price action, which is my base case scenario for the short-to-medium term, will result in an even greater percentage of the supply being accumulated by the long-term HODLers, which will increase the potency of a future bull run. We have recently entered a regime in which price is increasing at a faster rate than difficulty. Previous shifts in the regime (highlighted in red below) have resulted in significant price appreciation. The relationship between price and difficulty is interesting. What you tend to see is difficulty lagging behind price. When the price goes parabolic during bull runs, everybody wants to start mining. This spawns more investment into mining rigs and infrastructure, which results in difficulty increasing in the 6-18 months following bull runs, once said infrastructure gets built out. Inversely, during bear markets, as price decreases, a few months later the growth rate of difficulty begins to slow, or turn negative, as less capital is invested into mining, and inefficient miners begin to unplug. During the absolute trenches of the bear market you see significant miner capitulations (as denoted by hash ribbons, discussed in the mining section below). These capitulations decrease difficulty in the short term, and shift the longer term trend to signal decaying difficulty growth. Now, we have reached the point in the cycle where price is increasing at a faster rate than difficulty. This has historically preceded major increases in price. Moreover, this is great for incumbent miners as they are now more profitable and will have to sell fewer BTC to pay off their electricity bills. Bitcoin Mining
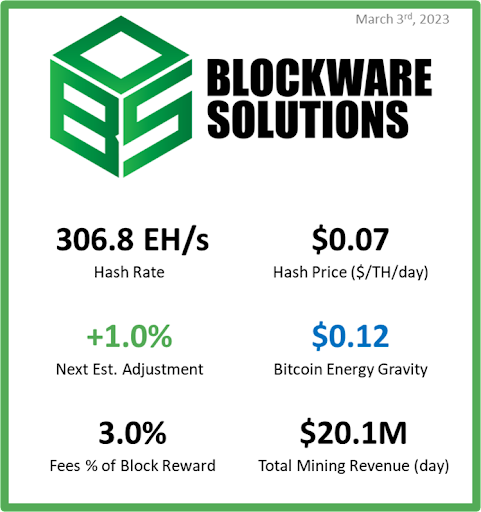
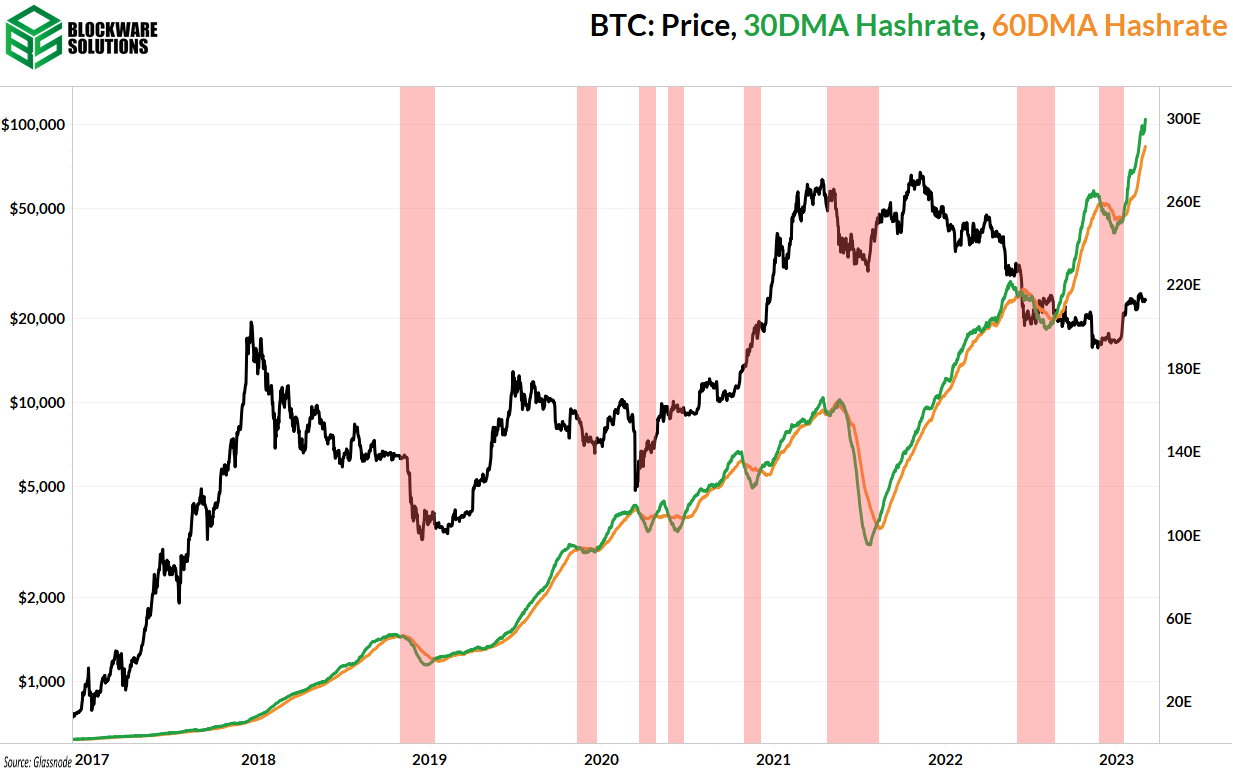
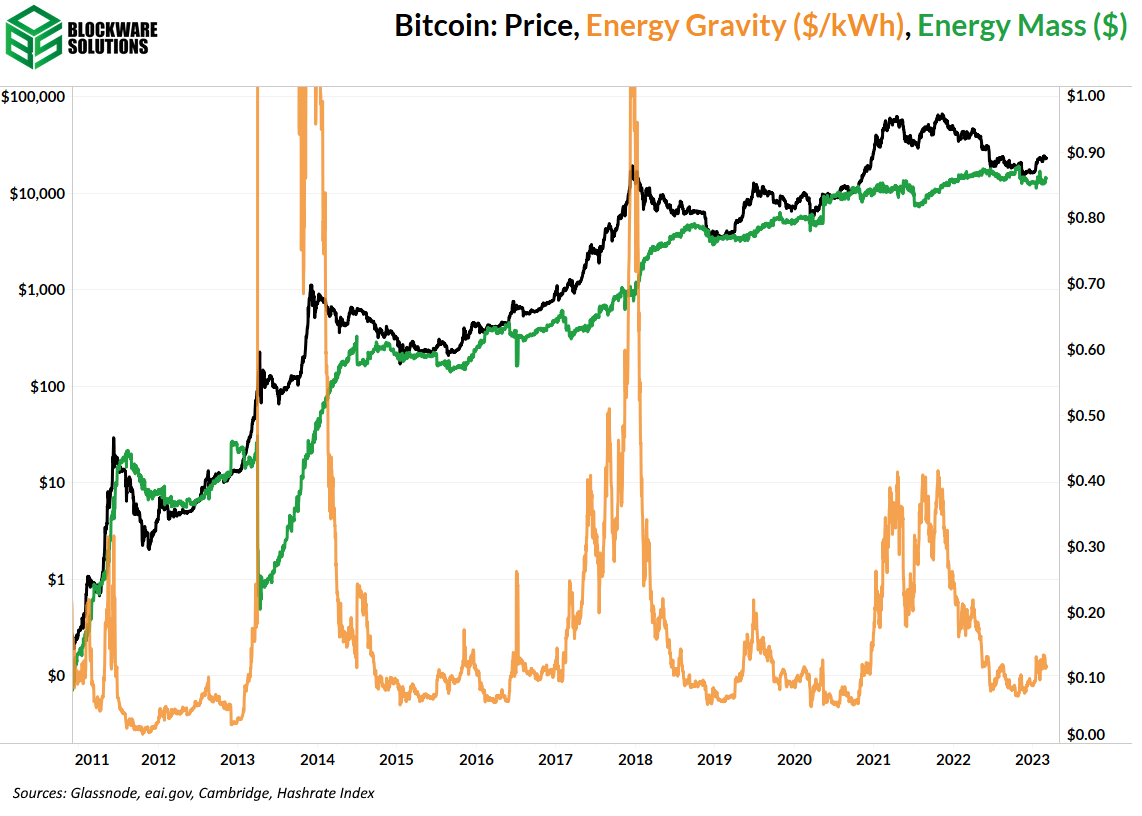
Bitcoin miners must constantly be aware of where they sit from an efficiency standpoint in the competitive landscape. The two critical components of a miner’s efficiency and profitability are its “all-in” electricity rate and the ASIC model operating. Looking at the table above, calculated using a BTC price of $22,350 and a hashprice of $0.067, you can see where various models remain profitable and unprofitable looking purely at operating expenses. Hash Ribbons As mentioned all throughout 2022, hash ribbons is a metric that indicates when Bitcoin miners are net-capitulating, meaning more miners are turning off than turning on. Miner capitulations have a highly accurate track record at predicting market bottoms. During the 2022 bear market, Bitcoin experienced two serious miner capitulations that were covered in the newsletter. Both capitulations indicated that $20,000 BTC likely had limited downside ahead. So far, BTC has struggled to move significantly below $20,000. Energy Gravity The following charts are based on a previous Blockware Intelligence Report that models the relationship between Bitcoin’s price and its production cost. The model makes it easy to visualize when the price of Bitcoin is overheated or bottoming. All content is for informational purposes only. This Blockware Intelligence Newsletter is of general nature and does consider or address any individual circumstances and is not investment advice, nor should it be construed in any way as tax, accounting, legal, business, financial or regulatory advice. You should seek independent legal and financial advice, including advice as to tax consequences, before making any investment decision. Blockware Intelligence Newsletter is free today. But if you enjoyed this post, you can tell Blockware Intelligence Newsletter that their writing is valuable by pledging a future subscription. You won’t be charged unless they enable payments.
Read Blockware Intelligence Newsletter in the app
Listen to posts, join subscriber chats, and never miss an update from Blockware Intelligence.
© 2023 Blockware Solutions |


