Blockware Intelligence Newsletter: Week 80
Blockware Intelligence Newsletter: Week 80Bitcoin on-chain analysis, mining analysis, macro analysis; overview of 3/18/23-3/24/23
Blockware Intelligence Sponsors
Summary:
General Market Update Before we begin, I wanted to share with you this week’s edition of the Blockware Intelligence Podcast, hosted by the author of the mining section of this newsletter, Joe Burnett (@iiicapital). This week’s podcast featured me, Blake Davis (@BlakeDavis50), alongside a friend and brilliant macro analyst, Caleb Franzen (@CalebFranzen). We discussed some really interesting topics including:
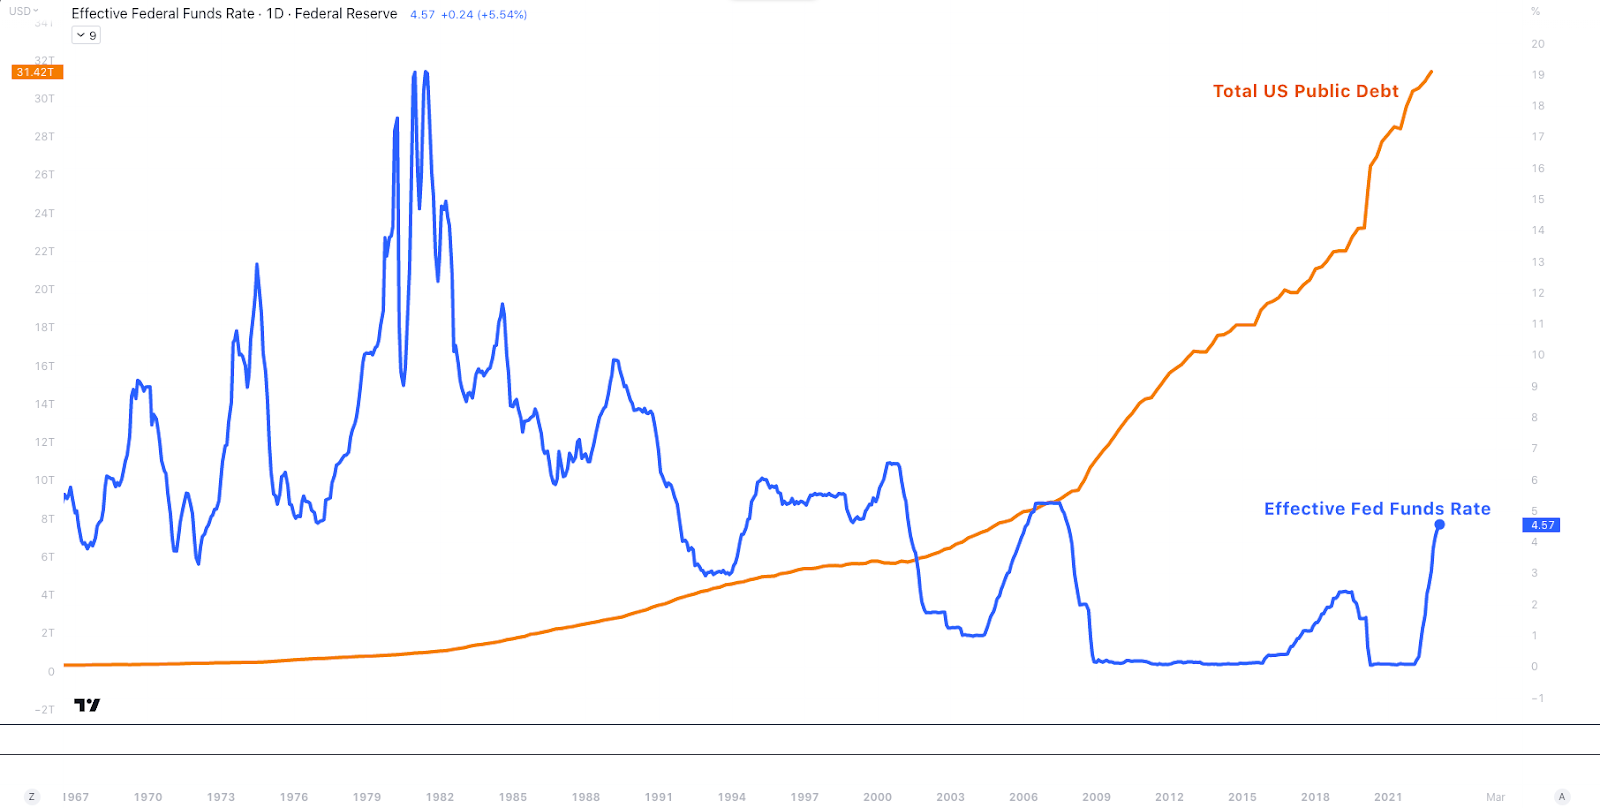
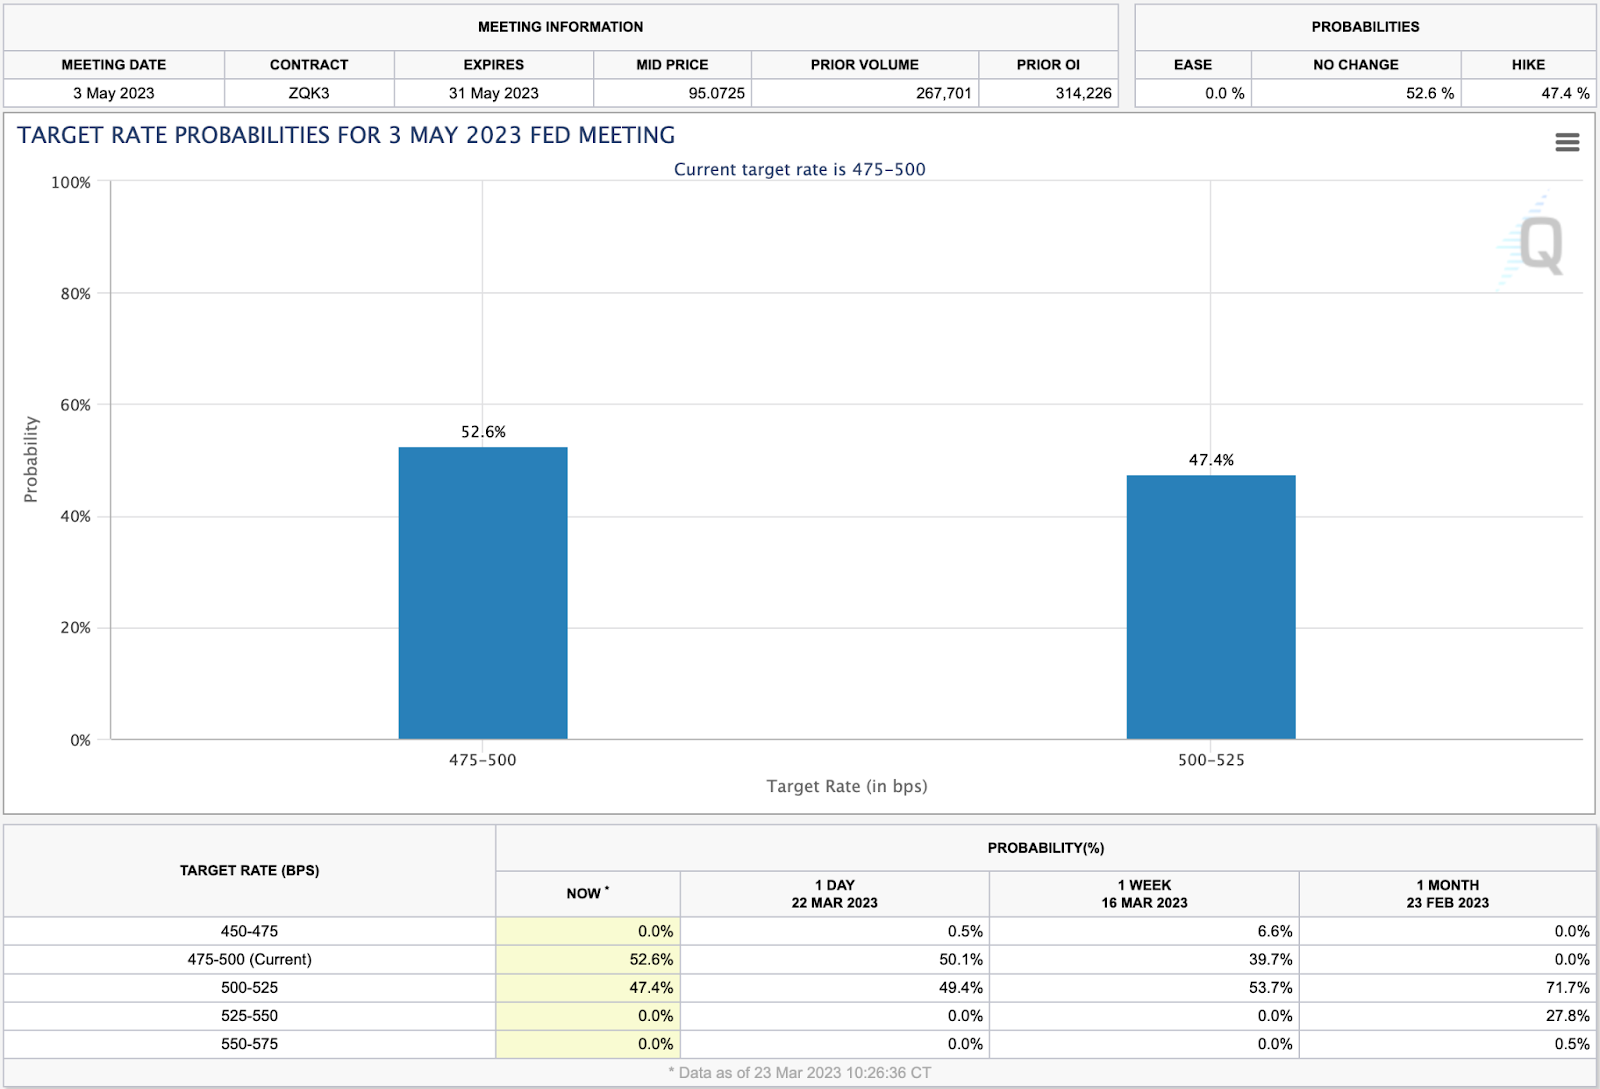
These topics are quite similar to the newsletter you are about to read, so if you’re looking to learn some more, I’d highly recommend checking it out! That being said, let’s get into it! It’s been quite the week for the markets following the Fed Open Market Committee (FOMC) meeting on Wednesday. In case you missed it, FOMC elected to raise the market interest rate by 0.25% into a target range of 4.75-5.00%. Effective FFR vs. Total US Public Debt, 1D (Tradingview) With the Fed Funds Rate now at levels not seen since 2007, the US is now facing an interest burden that could be overwhelming. As shown above, the amount of total public debt has grown by about $22 trillion (or 234%) since the last time the FFR was this high. With rates where they were 16 years ago, but outstanding public debt significantly higher, the cost to service that debt has risen dramatically. We’ve already begun to see the burden of illiquidity take a stranglehold on certain sectors of the economy, with this dynamic crescendoing with the collapse of SVB just 2 weeks ago. If we see this type of activity spill over into the consumer base, where average Americans are no longer able to make payments on their homes, cars, credit cards, etc. the US would likely face the worst economic crisis we’ve seen in a long time. This is a major reason why many market participants expected to see the Fed implement a change in strategy on Wednesday. However, this wasn’t quite the case. The Fed has offered the Bank Term Funding Program (BTFP) in order to loan out liquidity to banks. This program offers loans of up to 1 year, using securities (largely Treasuries) as collateral. This has led to the Fed beginning to grow their balance sheet for the first time since QT began in May 2022. Whether or not the increase to liquidity will be enough to cause an increase in inflation is anyone’s guess at this point. However, we have seen major utilization of the BTFP, to the tune of hundreds of billions of dollars. We have also seen a major spike in utilization of the Fed discount window. As previously mentioned, FOMC went for its 2nd consecutive 25bps rate hike, and is continuing to allow their Treasury assets to mature (AKA quantitative tightening). The Fed did, however, provide a bit of clarity to the market, stating that they are seemingly unconcerned about the banking sector as a whole. Policy makers believe that the liquidity provided by the BTFP will be enough to prevent a systematic bank run. Furthermore, the rate decision alone proves that the Fed has confidence in the overall strength of the US economy. If they had elected to pause rate hikes, FOMC would be showing the world that they believe the US economy needs saving. The decision to raise by 0.25% was unanimous amongst the 12 voting members of FOMC. However, due to the overwhelming economic uncertainty that has defined March of 2023, the Fed clearly needed to show a united front at this meeting. There are likely a few Fed officials nursing broken fingers today (joking). FedWatch Tool, May 3rd FOMC Meeting (CME Group) As you can see above, the FFR futures market is currently predicting that Wednesday’s 25bps hike will be the last of this cycle, albeit by a small margin. This is despite Chairman Powell iterating that future rate increases may still be necessary, and the Fed dot plot showing the median FOMC member sees one more hike in our future. Speaking of the dot plot, FOMC also released their quarterly summary of economic projections on Wednesday. FOMC Summary of Economic Projections The table above shows us FOMC member’s current future outlook on real GDP growth, unemployment, PCE inflation, and the Fed Funds Rate. In summary, FOMC’s economic projection shows us that since the last projection, the median FOMC official now expects:
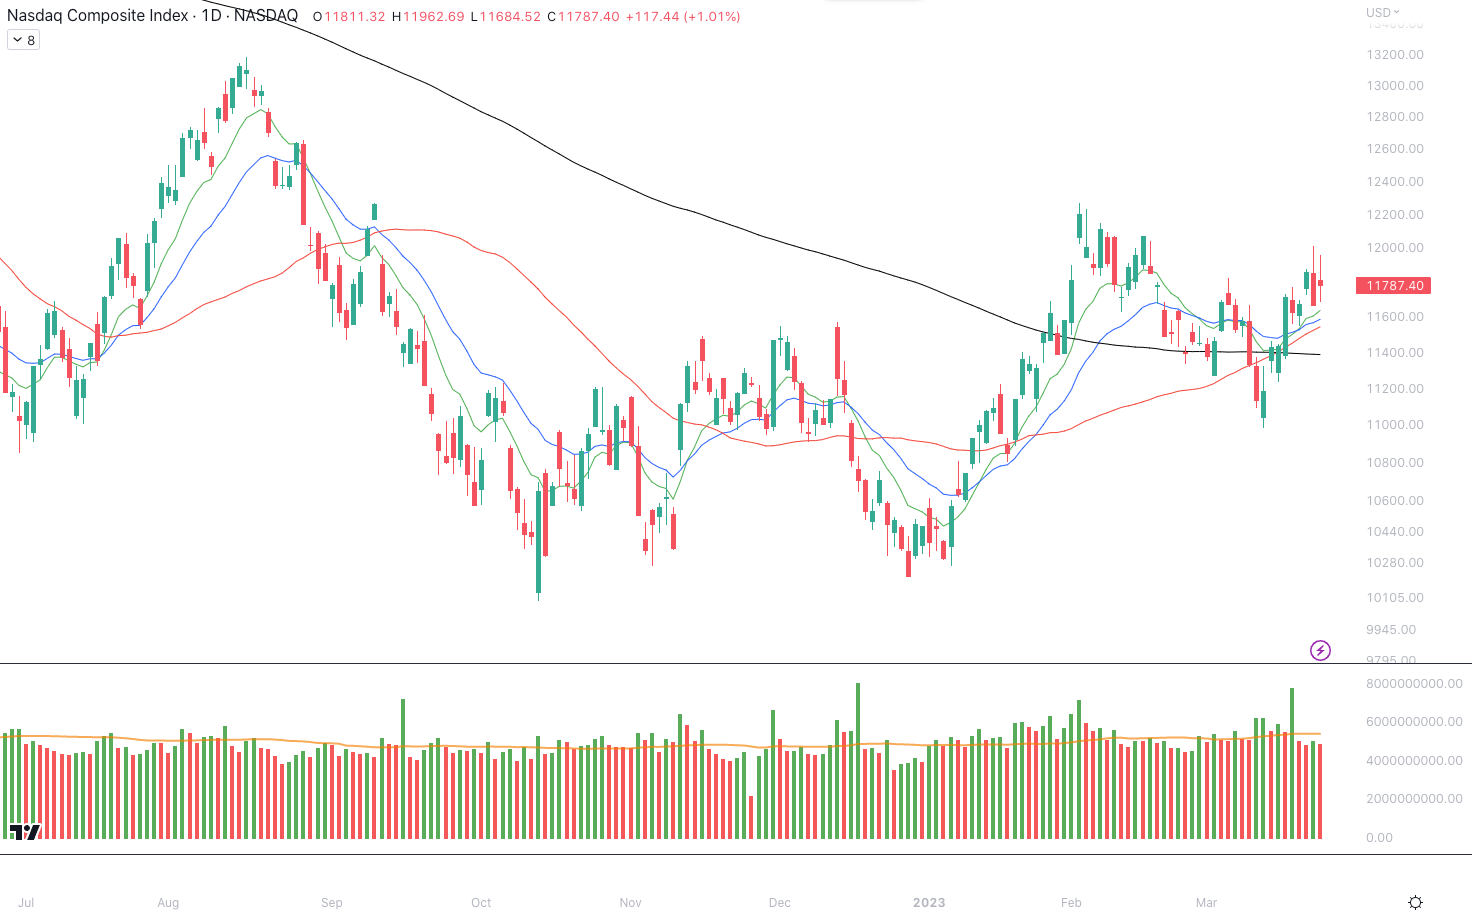
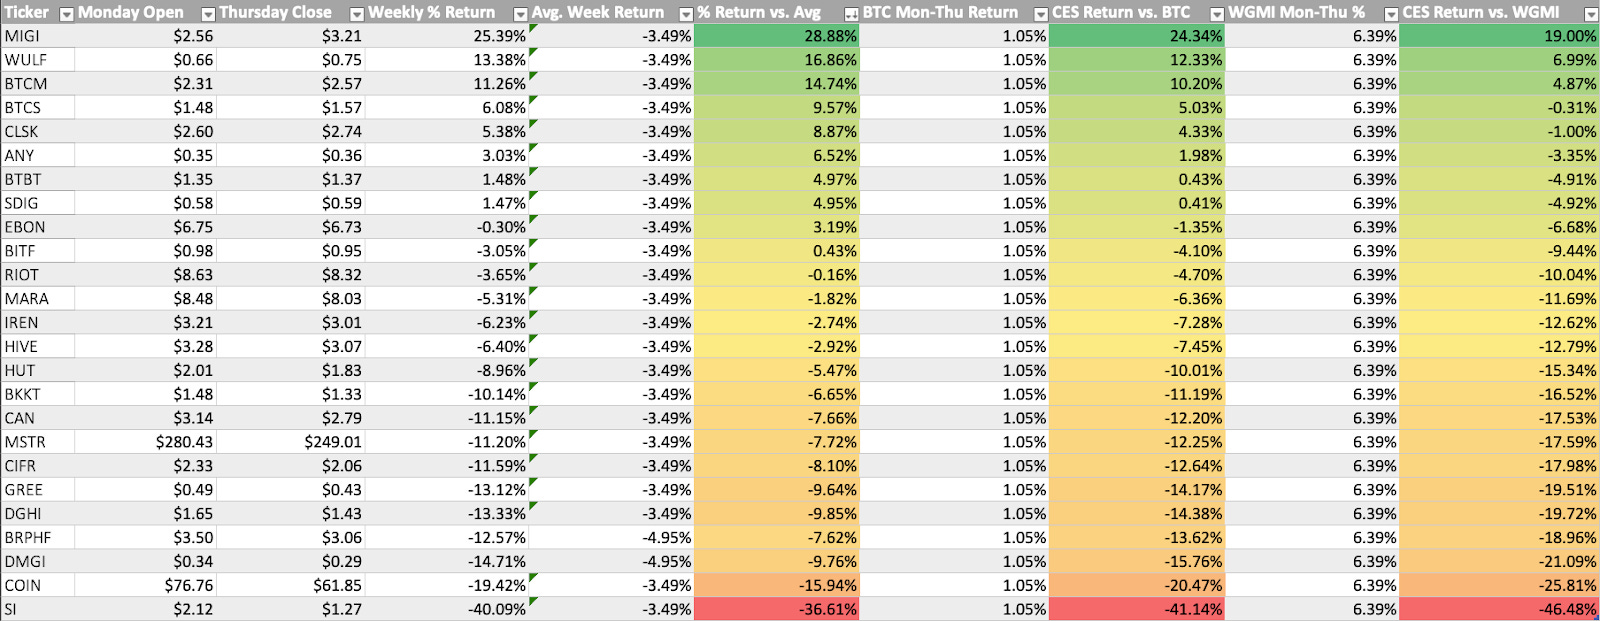
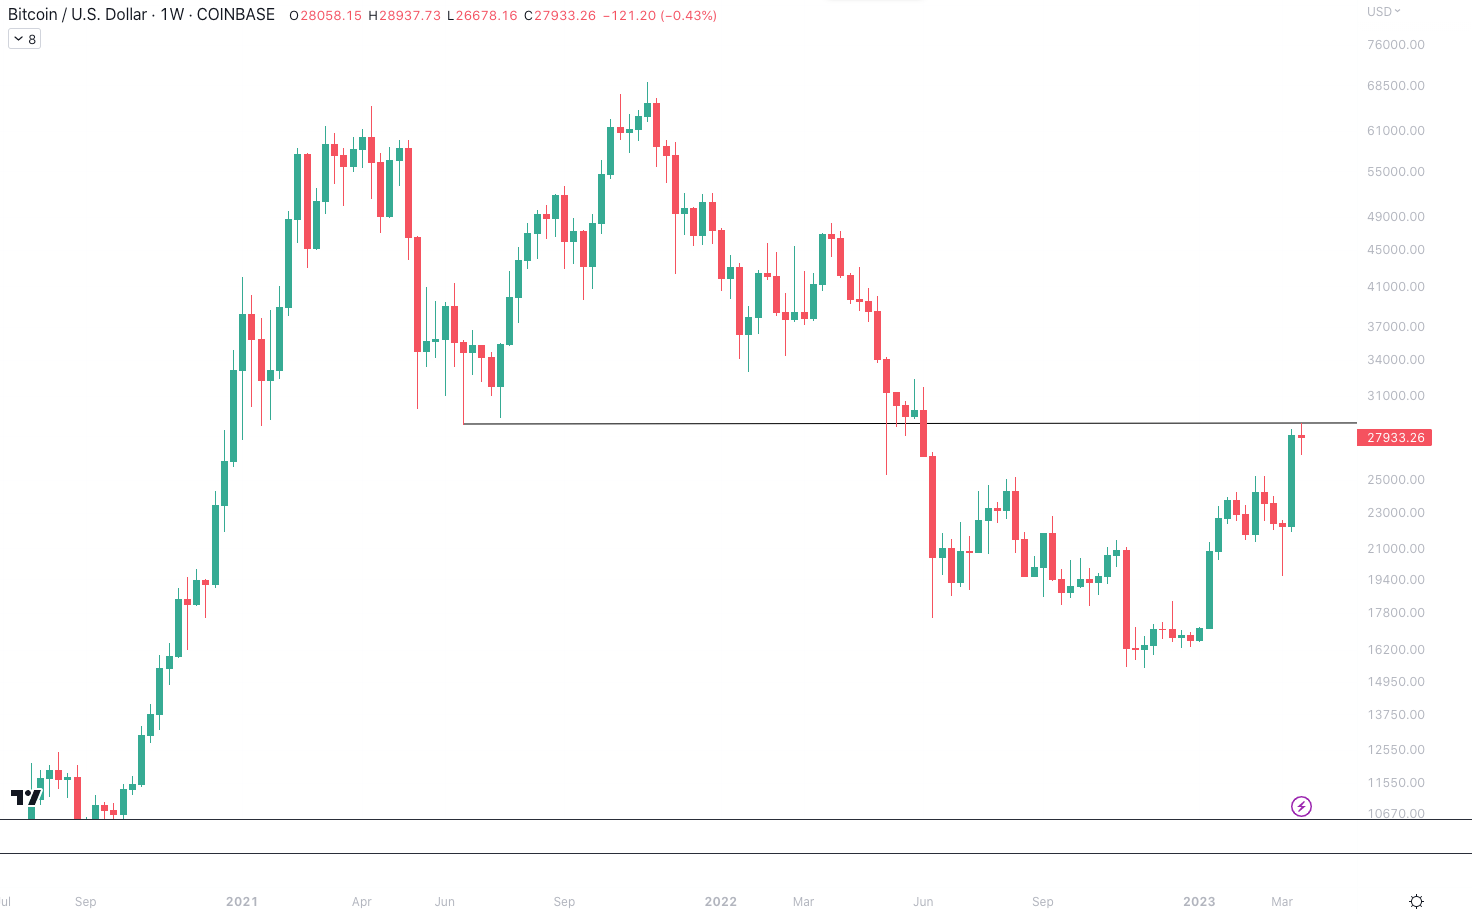
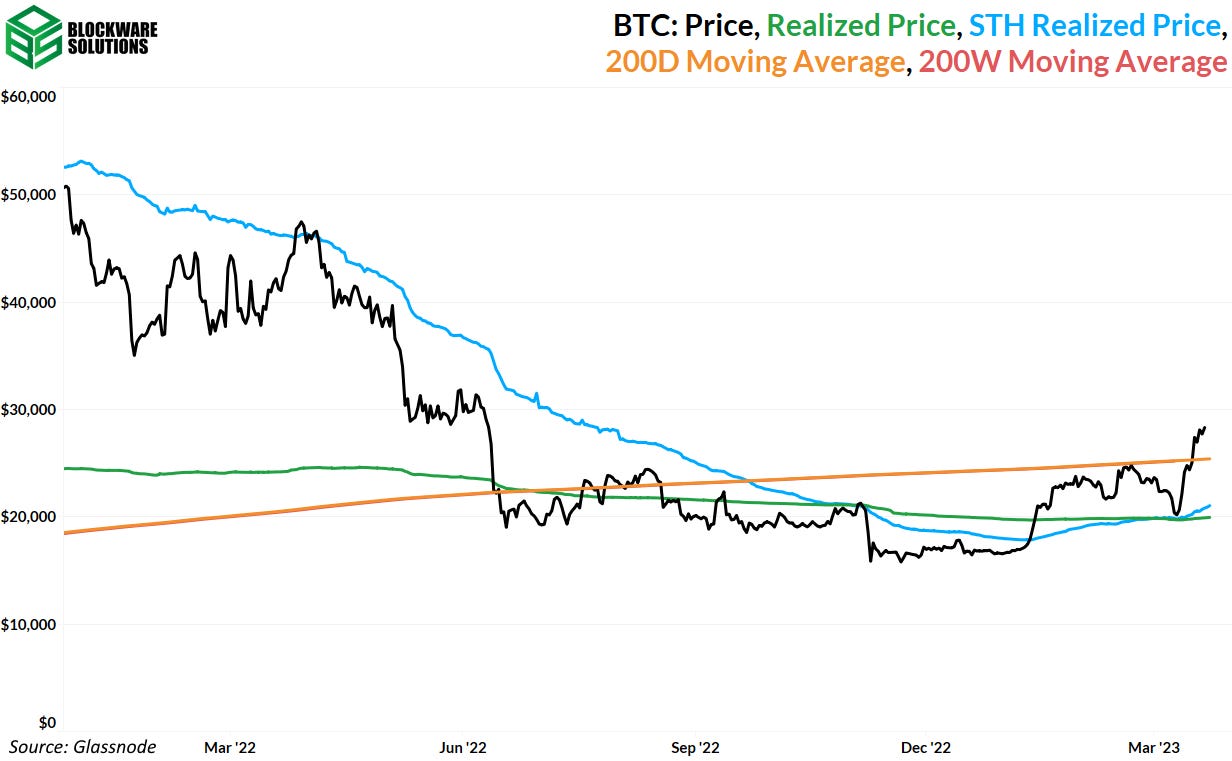
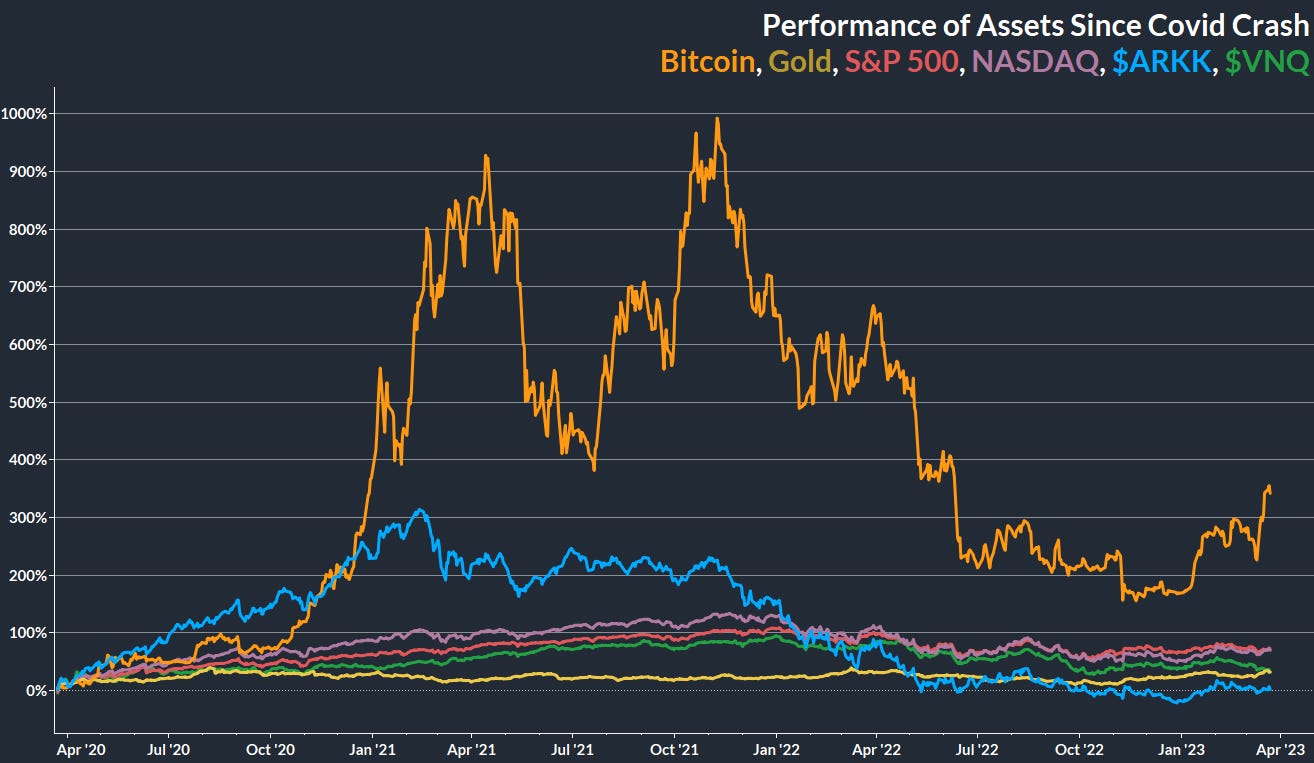
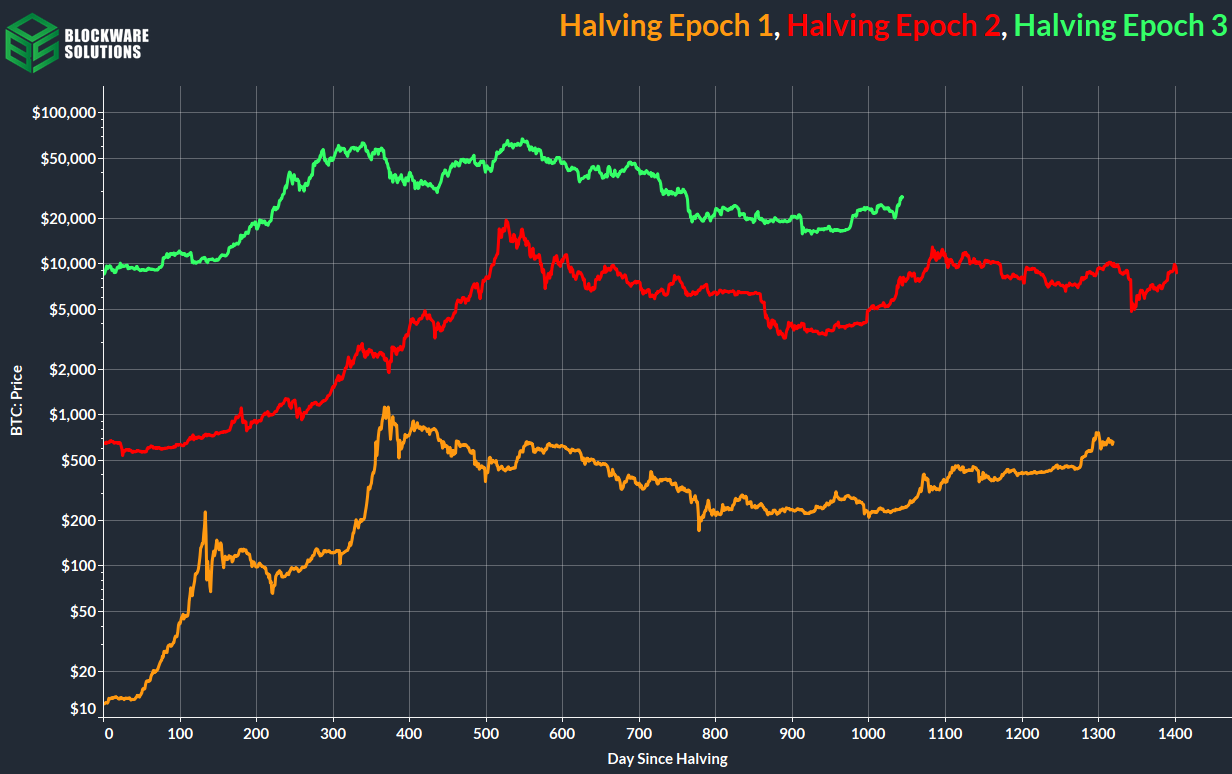
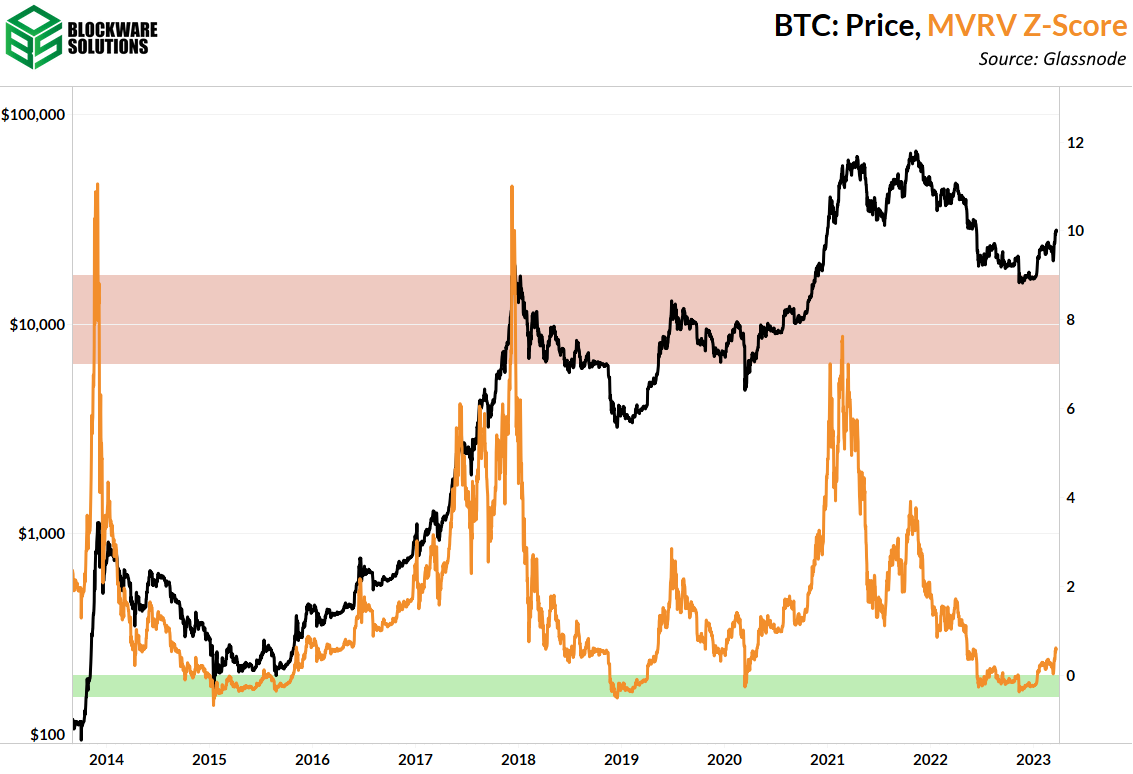
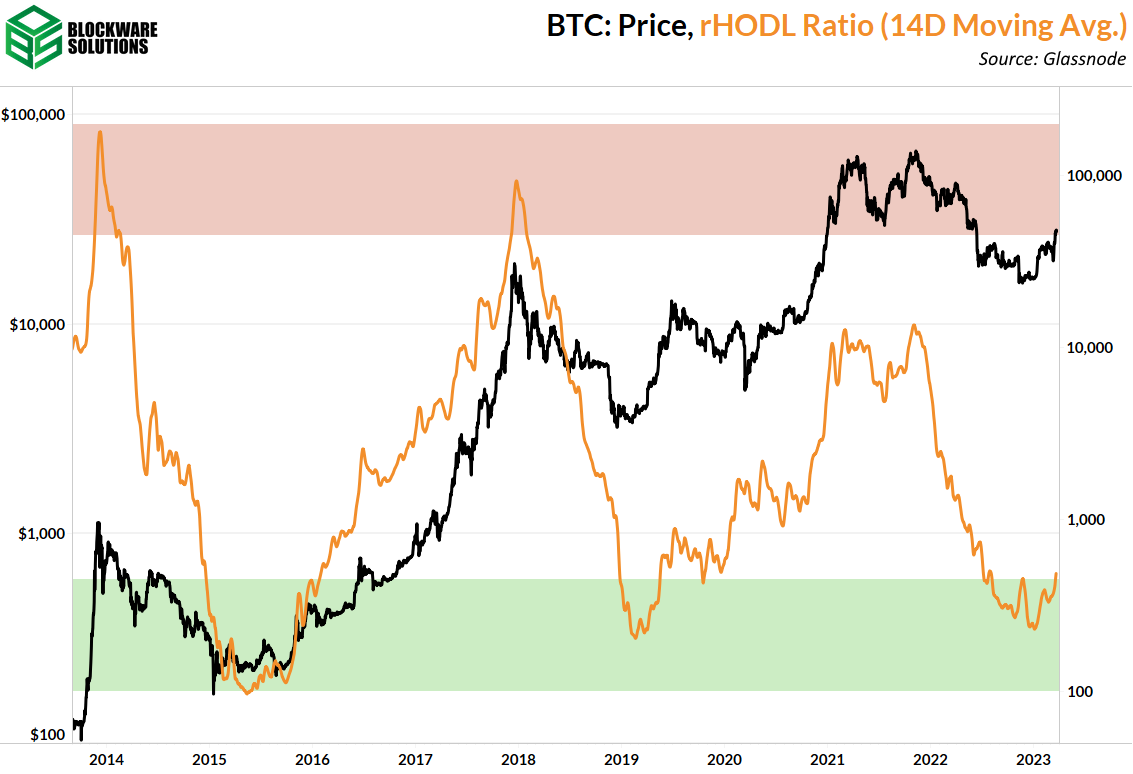
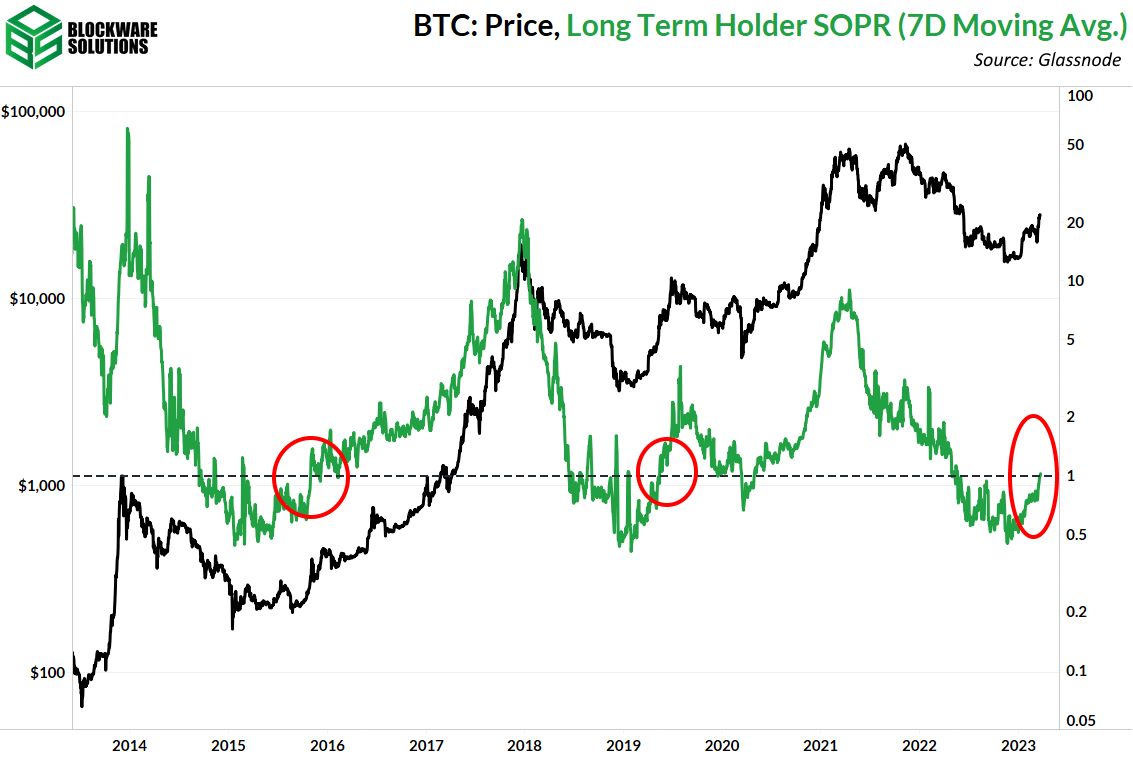
Despite the belief from Fed officials that we may see 1 more hike in 2023, the market clearly does not believe it. On Wednesday and Thursday we saw a drop in Treasury yields, as investors bought government bonds betting on rates having peaked. Furthermore, we saw a drop in the US dollar, which is another common signal that the market believes the Fed will now pause. Of course, whether the market is right or wrong here won’t be known until FOMC meets again on May 3rd. The stock market has seen some volatility injected across the last couple sessions, as is to be expected on a Fed day. Nasdaq Composite, 1D (Tradingview) On Wednesday, stocks initially jumped higher on the Fed decision, as the confidence shown by Powell triggered buying across the market. This move was thwarted by the Secretary of the Treasury, Janet Yellen. Yellen told congress on Wednesday afternoon that she is not considering blanket insurance or the guarantee of all deposits for US banks. As confidence turned into more uncertainty, stocks sold off to end the session. On Thursday, stocks moved back higher, but once again sold off mid-day. This time the selling was not enough to bring the indexes into negative territory for the day. However, the candlestick we put in isn’t exactly bullish. Bitcoin-Exposed Equities In the land of Bitcoin-equities, we’ve seen an extremely mixed-bag of price action this week. Wednesday afternoon news broke that Coinbase (COIN) has been issued a Wells Notice by the SEC. For those who don’t already know, a Wells Notice essentially says that the SEC is preparing to bring forth civil charges against you, and are offering you an opportunity to respond publicly. While this doesn’t mark the collapse of another crypto exchange, COIN will likely have to scale back some of their product offerings. More than likely this means NFTs and staking won’t be offered on their platform, if I had to guess. As a result of the news, COIN was down ~14% on Thursday, however price did rebound fairly significantly from the open. Across public miners, the strongest names from a technical perspective were: MOGO, MIGI, CLSK, RIOT, BKKT and WULF. Above, as always, is the table comparing the Monday-Thursday performance of several bitcoin-exposed equities. Bitcoin Technical Analysis Following the last couple weeks of monstrous gains for Bitcoin, we’ve seen a productive sideways consolidation underway this week. Bitcoin / US Dollar, 1W (Tradingview) $28,800 has proven to be a major resistance level for BTC. As you can see above, this level is no coincidence. $28,800 was the exact bottom of the summer 2021 correction. This would be a logical place to see BTC make another leg lower, however a continued consolidation here would be welcomed. This is a fairly pivotal spot for bulls to defend in order to maintain this current bullish structure. A break above this level would obviously be the most ideal scenario for bulls, but if we are going to pullback, we would like to see BTC hold ~$25,200. Bitcoin On-chain and Derivatives Despite the Fed meeting, which is frequently a trigger of volatility, Bitcoin had a relatively lax week price-action wise; floating around $28,000. BTC is still above all major levels including the 200-week moving average. Short-term holder realize price, which has recently proved itself to be a support-level, is slowly trending upward. If you follow Blockware on Twitter you saw the following chart this week, but I wanted to discuss it in the newsletter as well. It has been exactly three years since the bottom of the 2020 Covid-market crash. While Bitcoin is not a risk-asset (recent events have made that abundantly clear), it has historically traded like a risk-asset. So, when judging the performance of risk-assets it makes the most sense to analyze their performance across cycles of liquidity, as global liquidity tends to be what has the most impact on the market value of risk assets. Since March 2020 Bitcoin has outperformed other notable risk assets and inflation hedges: BTC: +342% S&P: +71% NASDAQ: + 70% Gold: +32% Vanguard Real Estate ETF: +31% ARK Innovation ETF: +01.4% Considering we are entering a regime of increasing liquidity, vis-a-vis BTFP, it is likely that Bitcoin will, once again, outperform all other assets. Day-to-day price action has been the dominant narrative during the past two weeks, however, I want to take a second to zoom out. The four charts below serve as a reminder of where we are during the broader Bitcoin cycle. MVRV Z-Score, rHODL ratio, Halving Epochs, and Long Term Holder SOPR. Bitcoin has left the zone of deep value in these metrics. While in the deep value zone prevailing sentiment was that Bitcoin HAD to go lower because of macro turmoil. However, in hindsight, the bottom could not have been more obvious.
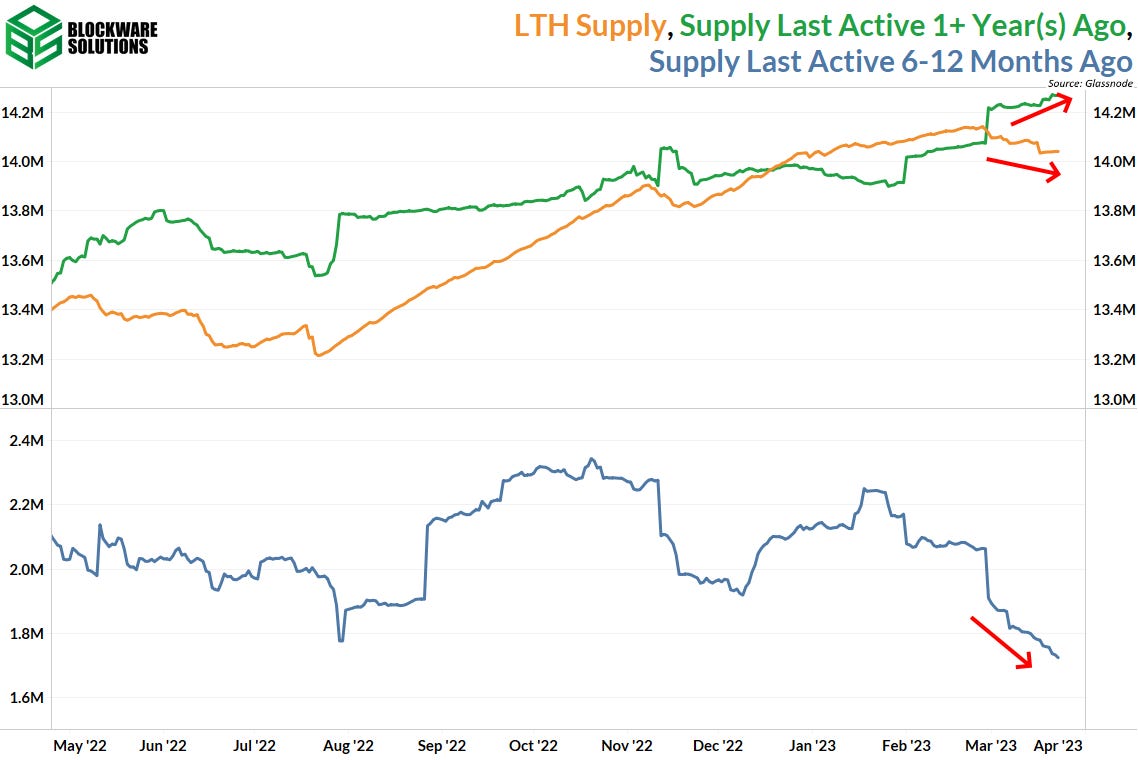
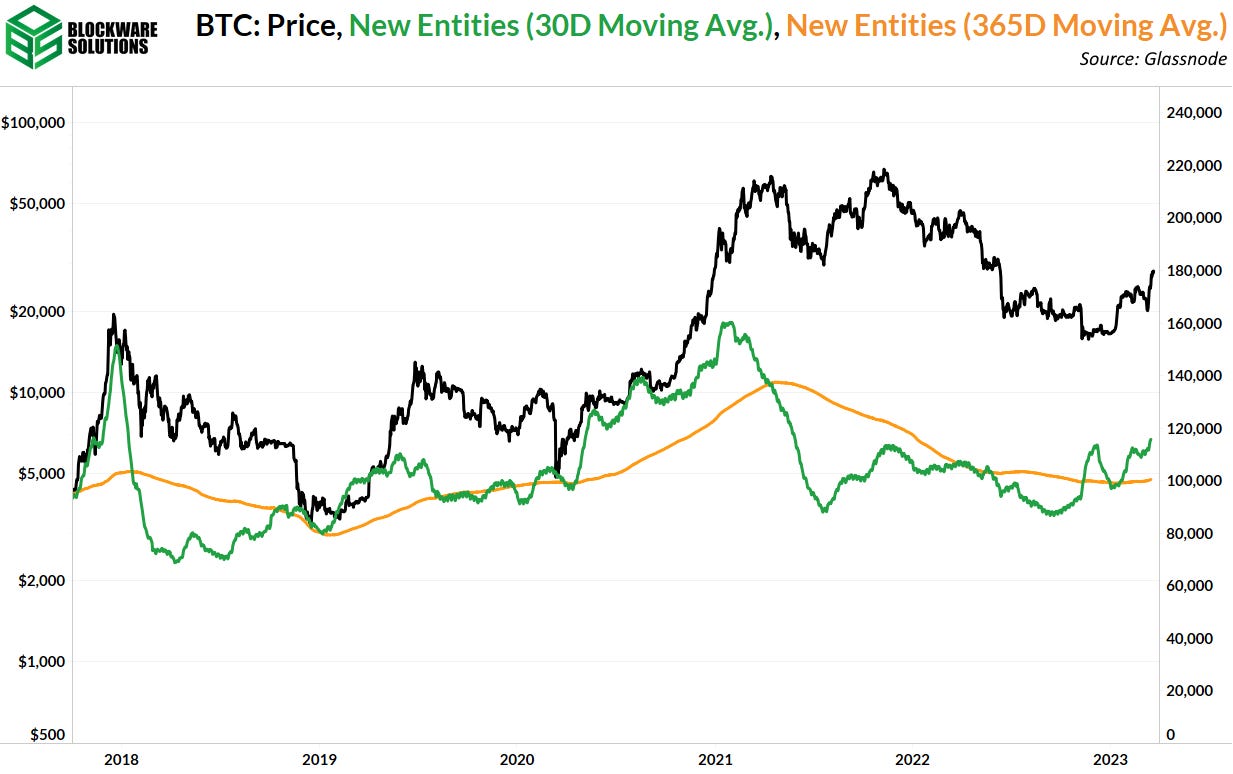
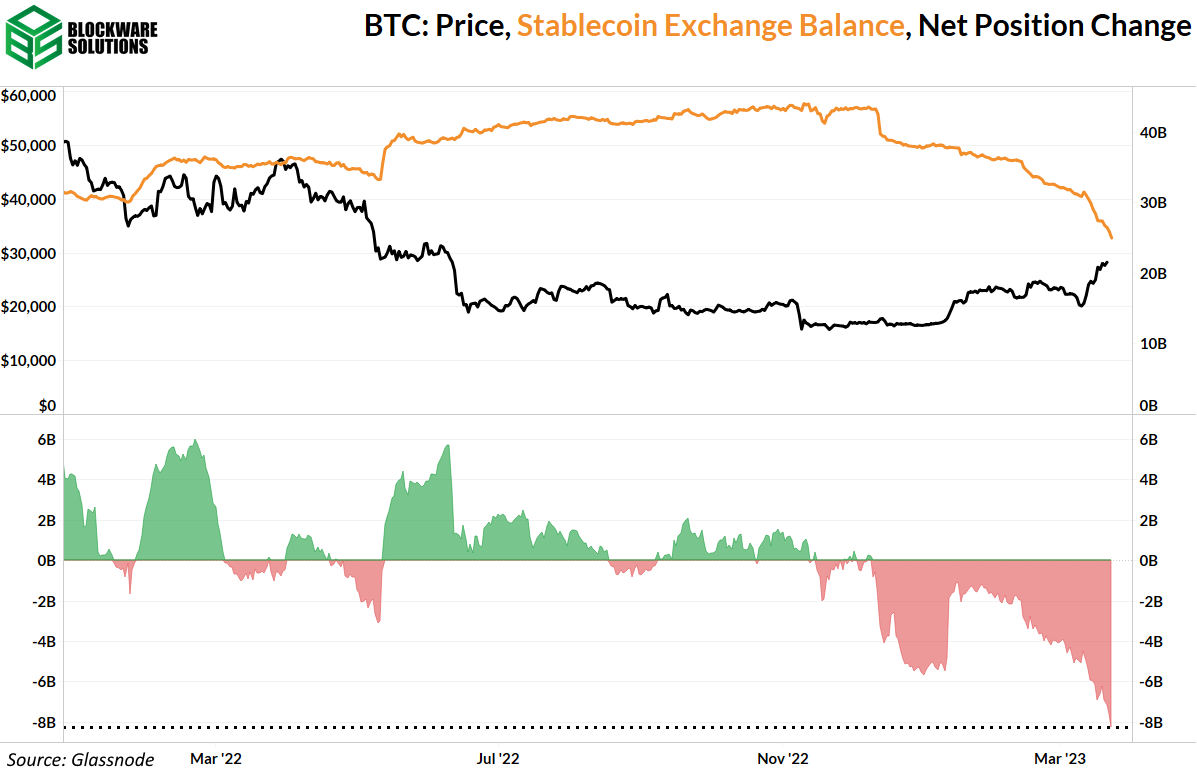
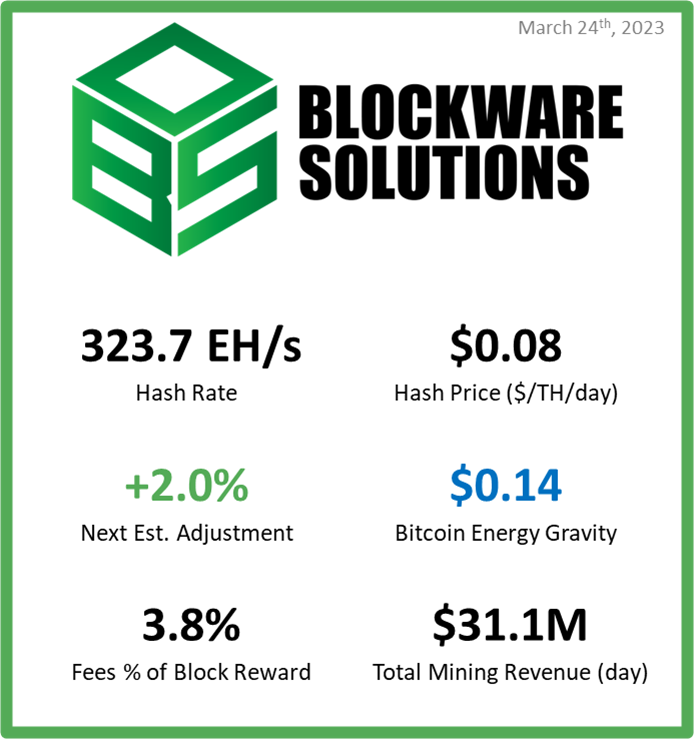
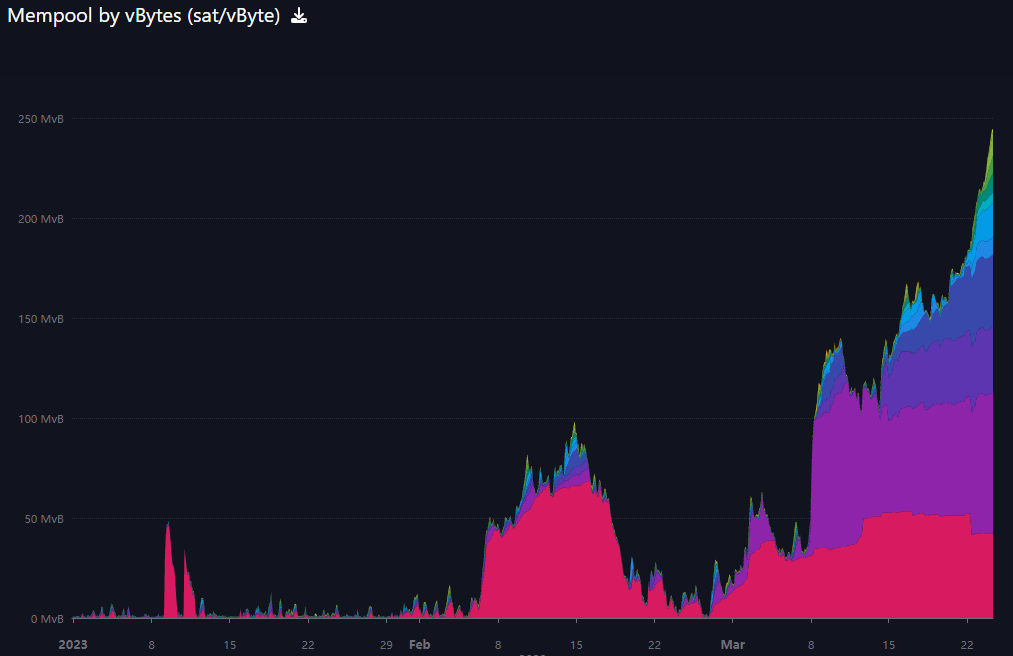
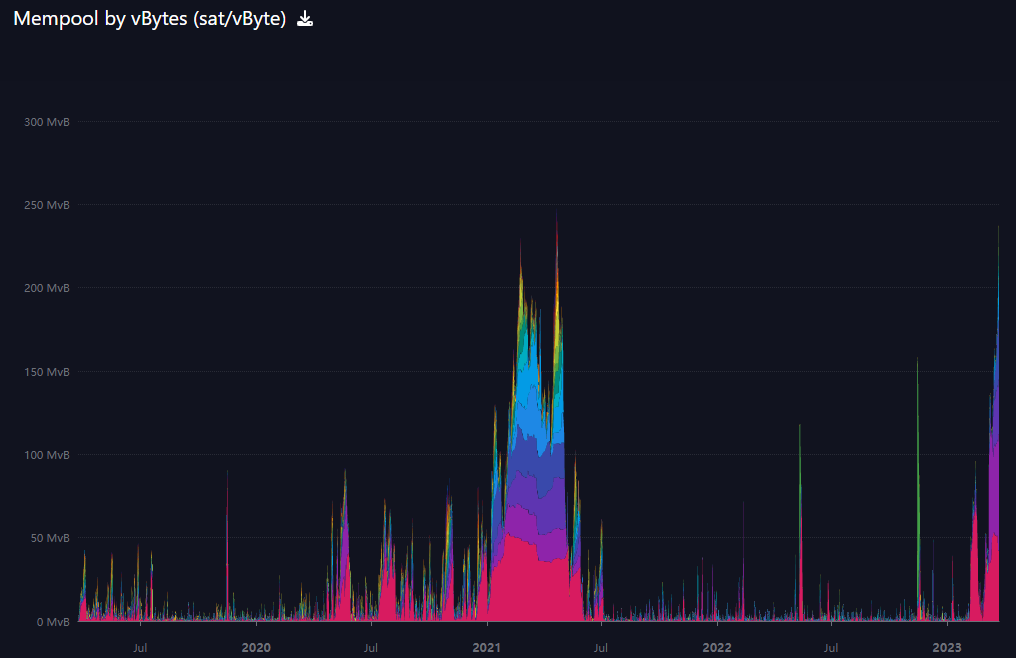
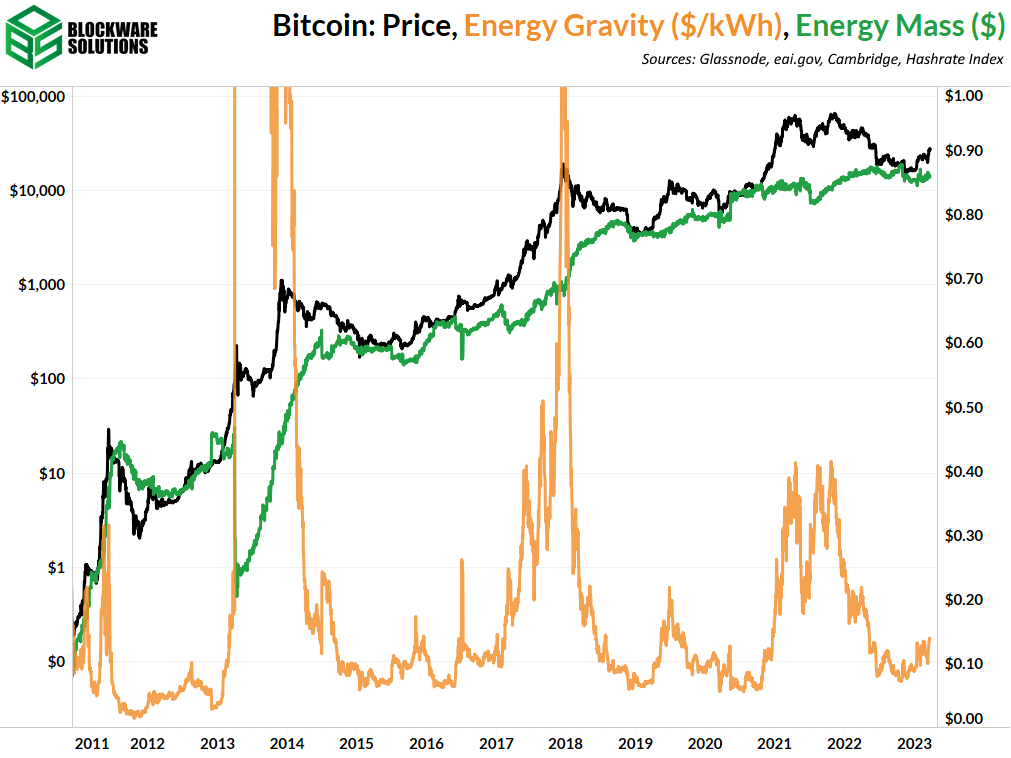
Long Term Holder SOPR (above) returning to a level greater than zero indicates that, in aggregate, long term holders are moving coins at a profit. Let’s dissect this a bit. Firstly, this behavior is in alignment with previous bear market departures and is certainly a bullish sign in that regard. We’ve entered a profitable regime. However, you may be inclined to believe that if long-term holders are taking profits, and the total supply held by long term holders is decreasing, does that mean long-term holders actually only care about fiat profits and are gearing up to dump their BTC onto the market? No. A long term holder is classified as anybody who has held BTC for 155 days or longer. 155 days ago was October 20th, 2022. Well after BTC had dropped to ~$20,000. Entities that acquired BTC between June 2022, post terra/luna and celsius implosion, and the aforementioned date are being classified as long-term holders; these are most likely the entities moving BTC at a profit here. When you juxtapose long term holder supply with the supply last active 1+ year(s) ago, you see that the former is declining while the latter continues to steadily increase higher. Thus, liquid supply is still incredibly limited and continues to be more so the case as this latter group continues to buy and hold. The structure of the derivatives market is healthy as the upwards price action of recent has not been accompanied by an increase in leverage. Increased spot demand plus limited supply for sale on the margin is the reason price has rocketed here recently; this was not driven by a short-squeeze. New entity momentum is positive (30D moving average > 365D moving average). Demand is re-entering the market at a rapid pace. Given the increasing uncertainty surrounding the traditional financial system, I expect the number of new entities will increase greatly throughout 2023. I saved the most important chart for last. The supply of stablecoins has plummeted; we’ve seen the largest 30-day net decrease in stablecoin balances of all time. This diminishing confidence in the ability of stablecoins to live up to their name has shifted their demand towards Bitcoin. Plenty of stablecoins remain to be sucked up by BTC and push the price further; the continuation of that trend appears to be likely. Bitcoin Mining 1GB of Pending Transactions in the Mempool The amount of pending transactions in the Bitcoin mempool is approaching record highs. There’s currently 1 full GB of transactions waiting to be included in a block by Bitcoin miners. If no new transactions are broadcasted to the network starting now, there would still be ~ 242 consecutively full blocks. For most mempools, you need to broadcast a transaction above 5 sat/vbyte to just be retailed by a node’s default max mempool. 20 sats/vbyte is required to get into the next block. Zooming out, according to mempool.space, the size of the mempool today measured in virtual bytes is approaching highs not seen since the peak of the 2021 bull market. Bitcoin users may not be too happy to pay up to move BTC, but Bitcoin miners certainly will scoop up all the fees they can. Miners typically look at all of the pending transactions in the mempool and pick the transactions paying the highest for the amount of block space the transactions consume. Effectively users transacting on Bitcoin are buying block space from miners who are producing blocks. If there’s more competition for a fixed amount of block space, fees typically move higher and miners profit. If you want to learn more about Bitcoin transaction fees and how this system will likely work as the block subsidy trends to 0 BTC, read this report from Riot Platforms (NASDAQ: RIOT) and Blockware Solutions. Energy Gravity The following chart is based on a previous Blockware Intelligence Report that models the relationship between Bitcoin’s price and its production cost. The model makes it easy to visualize when the price of Bitcoin is overheated or bottoming. All content is for informational purposes only. This Blockware Intelligence Newsletter is of general nature and does consider or address any individual circumstances and is not investment advice, nor should it be construed in any way as tax, accounting, legal, business, financial or regulatory advice. You should seek independent legal and financial advice, including advice as to tax consequences, before making any investment decision. Blockware Intelligence Newsletter is free today. But if you enjoyed this post, you can tell Blockware Intelligence Newsletter that their writing is valuable by pledging a future subscription. You won’t be charged unless they enable payments.
Read Blockware Intelligence Newsletter in the app
Listen to posts, join subscriber chats, and never miss an update from Blockware Intelligence.
© 2023 Blockware Solutions |


