Blockware Intelligence Newsletter: Week 81
Blockware Intelligence Newsletter: Week 81Bitcoin on-chain analysis, mining analysis, macro analysis; overview of 3/25/23-3/31/23
Blockware Intelligence Sponsors
Summary:
General Market Update
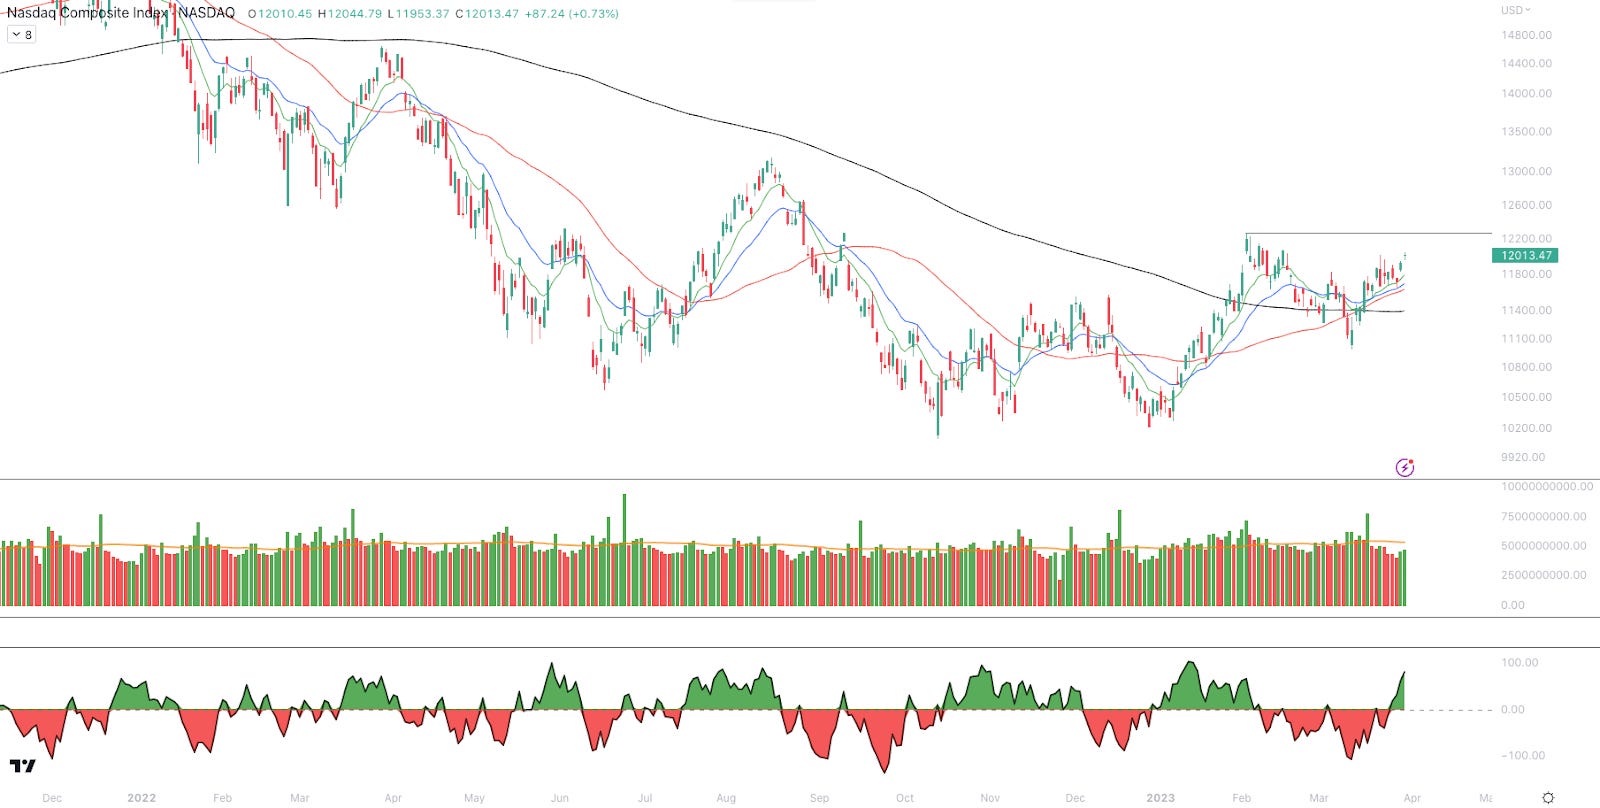
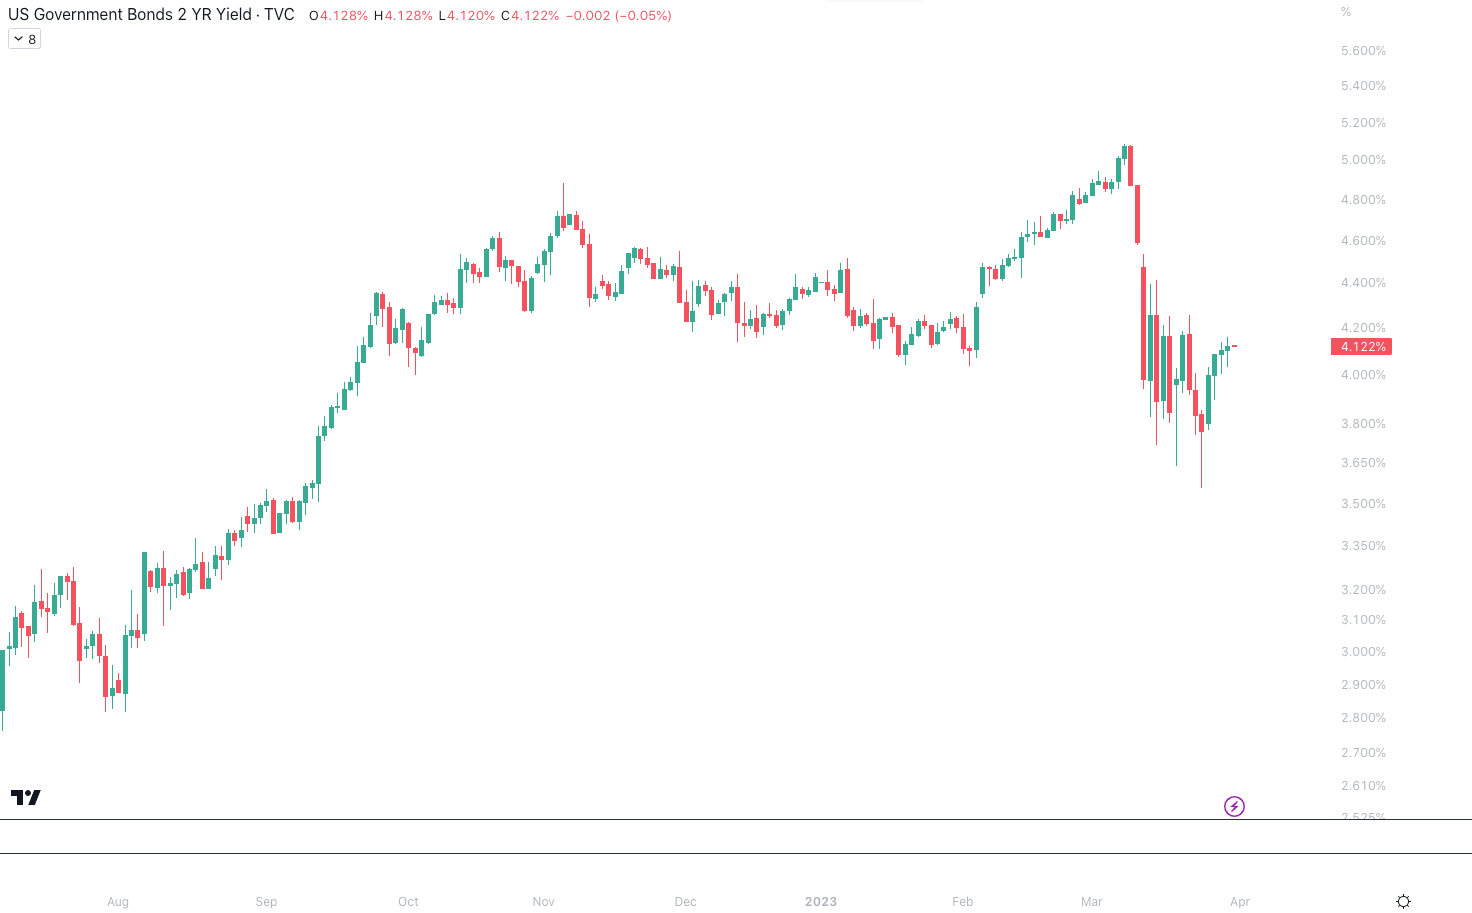
After a few consecutive weeks of craziness across markets, this week we’ve seen a welcomed (slight) slowdown in the news cycle. This morning we received February’s Personal Consumption Expenditures (PCE) inflation data. For those who may not know, PCE is the Fed’s favorite inflation gauge. As a reminder, PCE is a slightly different measurement of price increases than CPI. CPI measures the market prices of various goods, and by comparing their prices today vs. last year (or last month), it measures inflation. PCE on the other hand looks at the prices actually paid by consumers for those goods. While this difference is small, PCE also takes into account expenditures by rural customers, and purchases made by third parties on someone else’s behalf. The expectations for February were that headline PCE would come in at 5.3% YoY and 0.2% MoM. Core PCE (headline minus food and energy) was expected to come in at 4.7% YoY and 0.4% MoM. Instead, headline PCE came in at 0.3% MoM and 5.0% YoY. Core PCE was 4.6% YoY and 0.3% MoM. Clearly, this was a mixed bag of results. The impact of this data on the markets is yet to be seen, but the fact that inflation is remaining above 5% after a year of rate hikes and QT says a lot about the state of the economy. That being said, the month-over-month numbers are showing a slowdown in prices from Core inflation metrics. This is clearly a positive, and likely the biggest takeaway the Fed will draw from this data. As of Thursday’s close, we’ve seen a strong week for stocks, with the Nasdaq breaking into new March highs yesterday. Nasdaq Composite Index, 1D (Tradingview) The buying across the last few days has been fairly robust, as you can see an uptick in volume across the last 2 sessions after finding support at the 21-day EMA. Furthermore, the indicator at the bottom is the McClellan Oscillator, which is currently indicating an uptick in market breadth. The McClellan Oscillator compares two moving averages of the Advance-Decline Line to indicate when the amount of stocks increasing in price is increasing faster over the short-term vs. the longer-term average. Long story short, green candles from the index accompanied by an uptick in breadth is a good thing, as the rally gains more and more support. That being said, the Nasdaq has a significant resistance level hanging overhead at the YTD high of ~$12,024. Furthermore, we’ve seen an uptick in Treasury yields this week. 2-Year Treasury Yield, 1D (Tradingview) The rise in yield (or drop in price) from Treasuries has certainly been interesting to watch this week. Our base case is that yields have likely topped, as the market appears supremely confident that the Fed is done raising rates. However, we don’t have the coveted crystal ball and anything could happen. What makes the rise in yield so interesting is that the equity market doesn’t appear to care. Let me explain: Simply put, most institutional investors (who make up the majority of trading volume) use valuation calculations to determine whether or not an investment is “worth it”. The most common of which is the Net Present Value (NPV) equation. NPV discounts the expected cash flows to be received by buying and holding a stock by using a “discount rate”. Treasury yields are generally what is used as the discount rate. So by inputting the current yield of a short-maturity Treasury, and the expected cash flows from the stock, the NPV equation tells you what that investment is worth today. The equation above is the NPV equation. While the details aren’t overly important for the retail investor, note that “r”, or the discount rate, is in the denominator of the equation. Therefore, when yields (the discount factor) are rising, the NPV of an investment will fall. When the NPV of an investment falls, it means that it’s expected to be less profitable and usually results in a fall in demand and a rise in supply for a stock. This is the main reason why stock prices and Treasury yields tend to have an inverse relationship. This week, as yields and stocks have both risen, the market is saying 1 of 2 things.
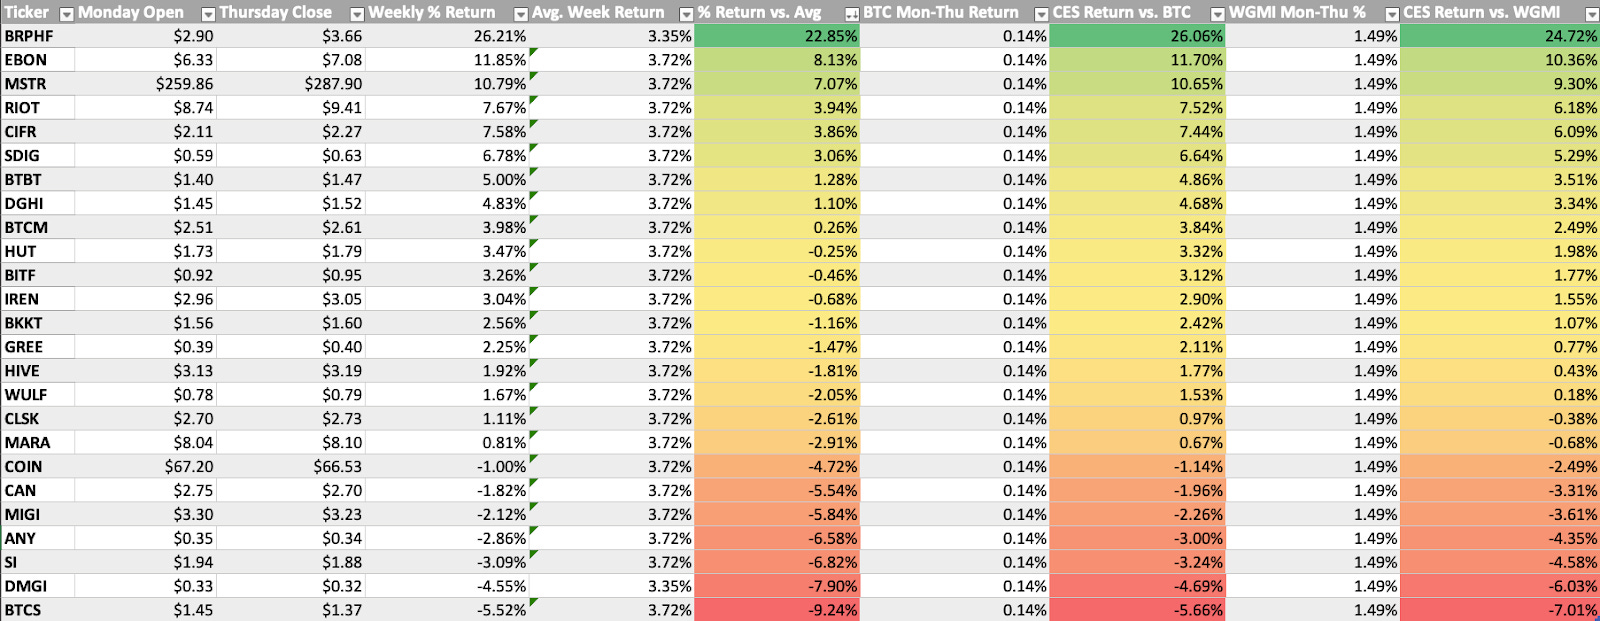
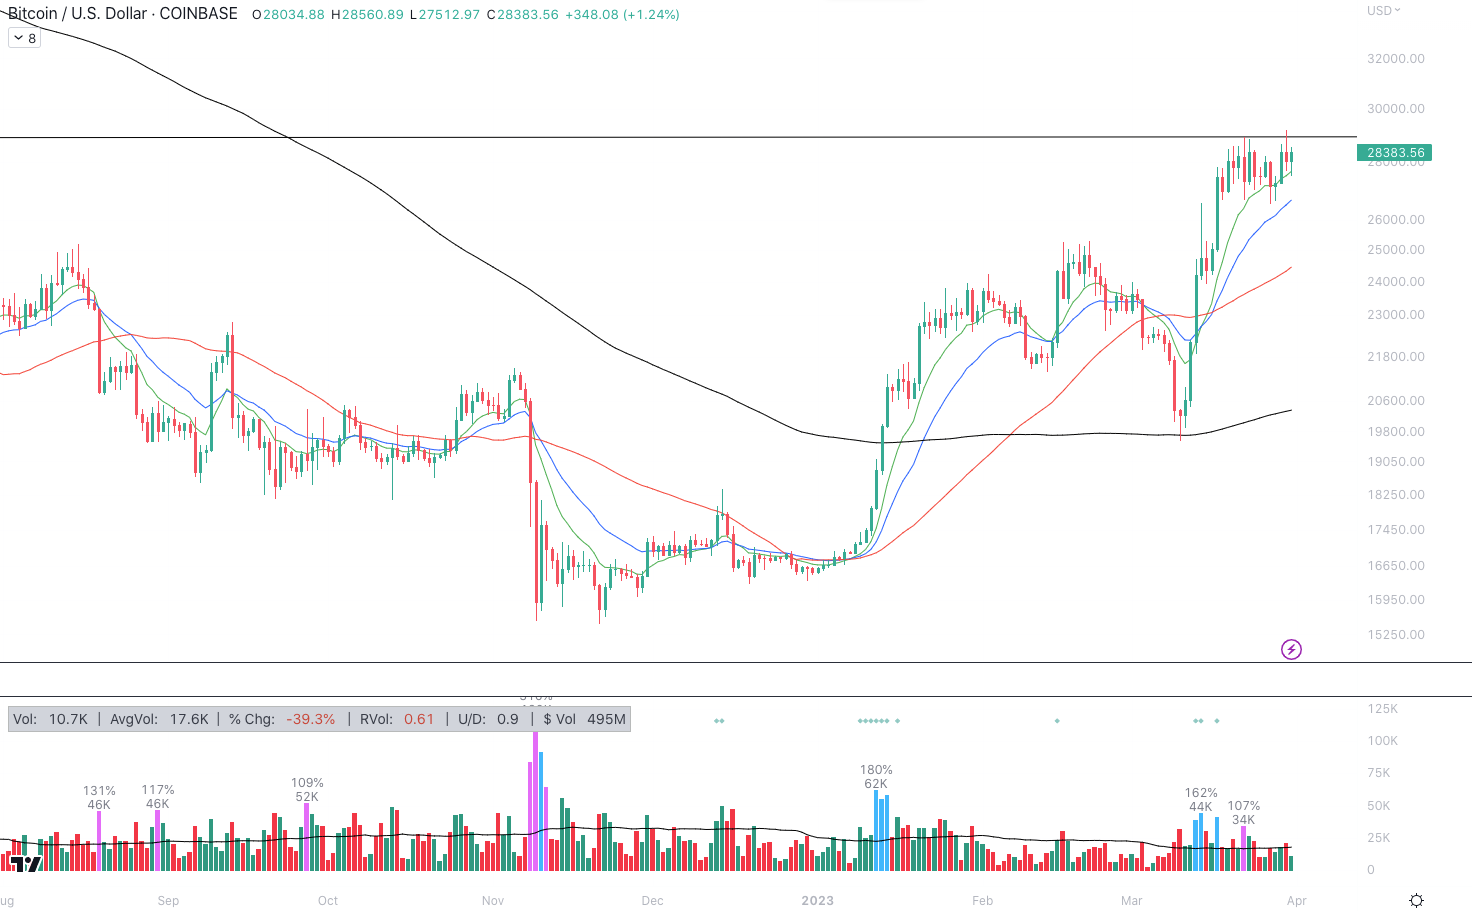
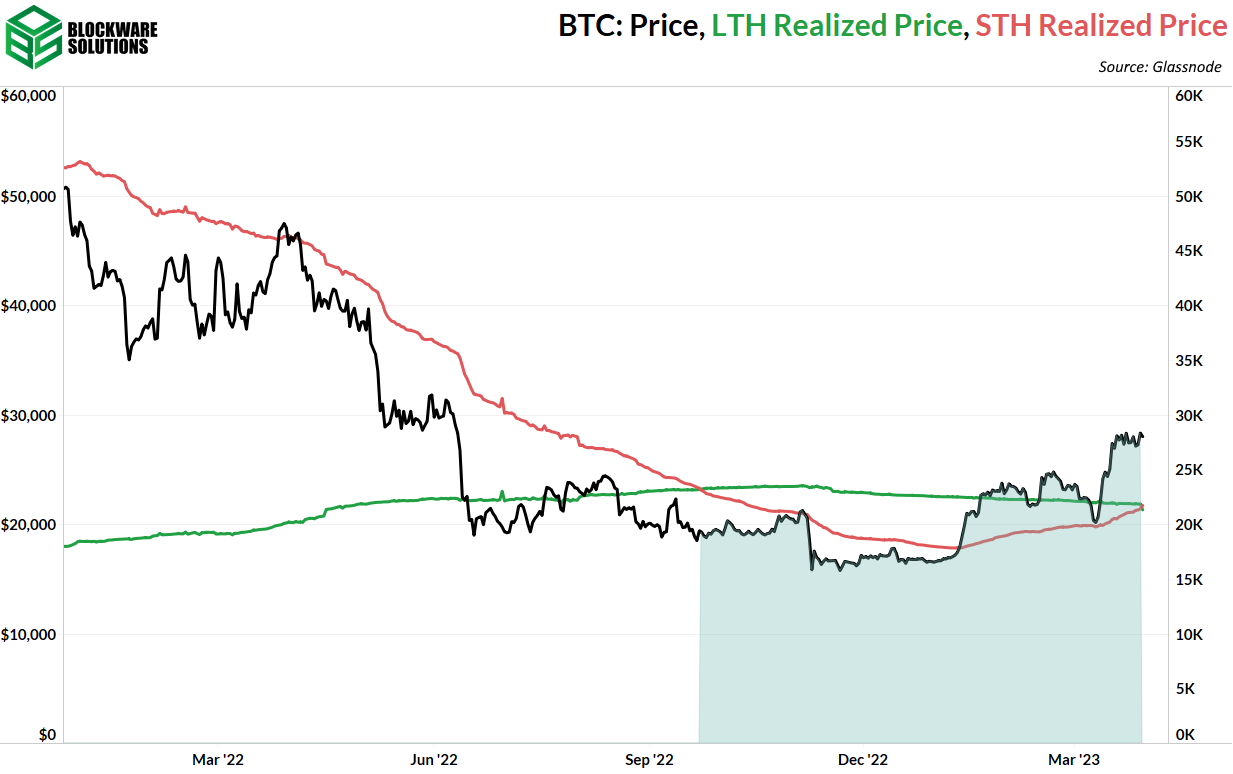
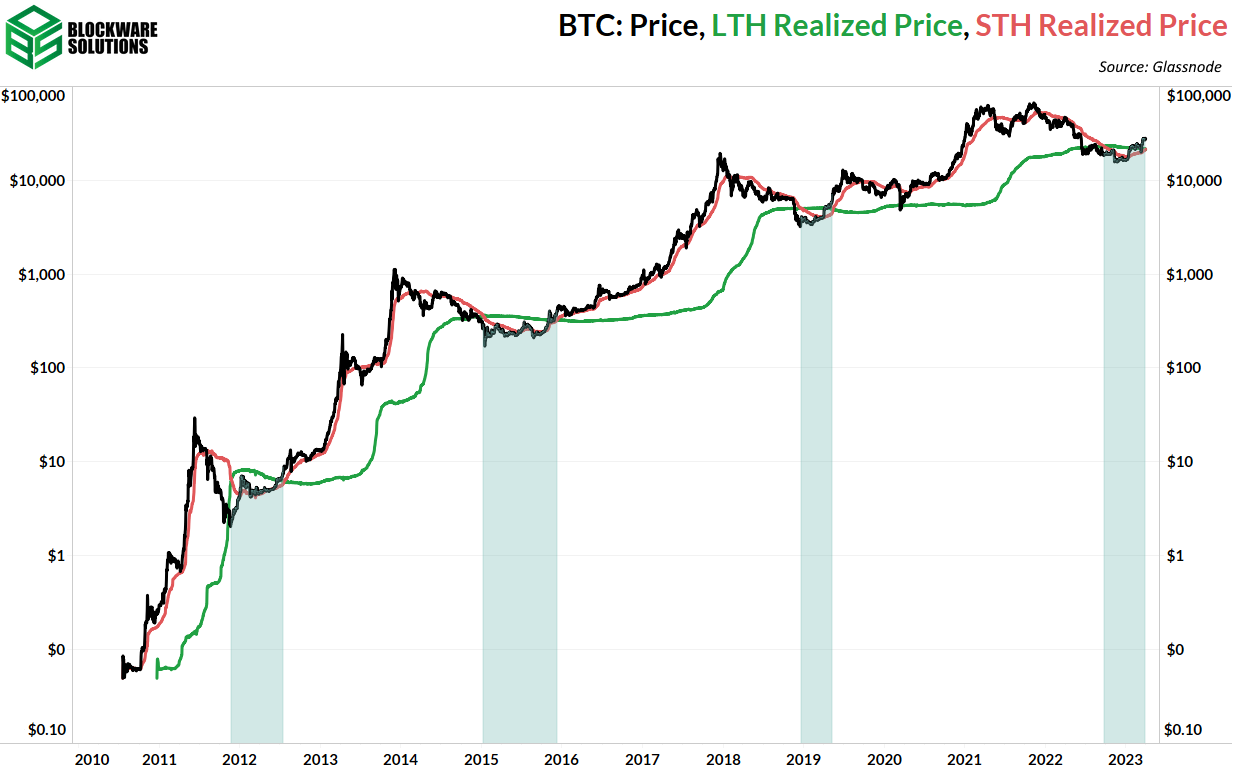
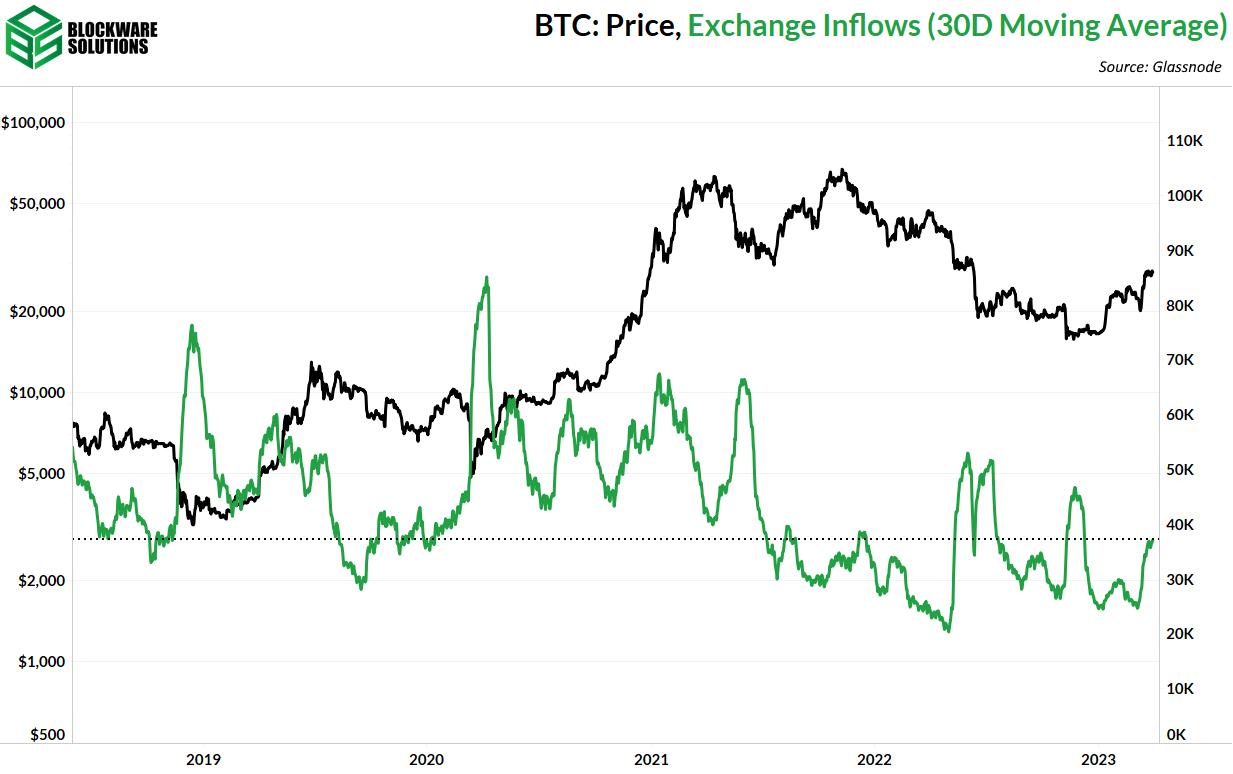
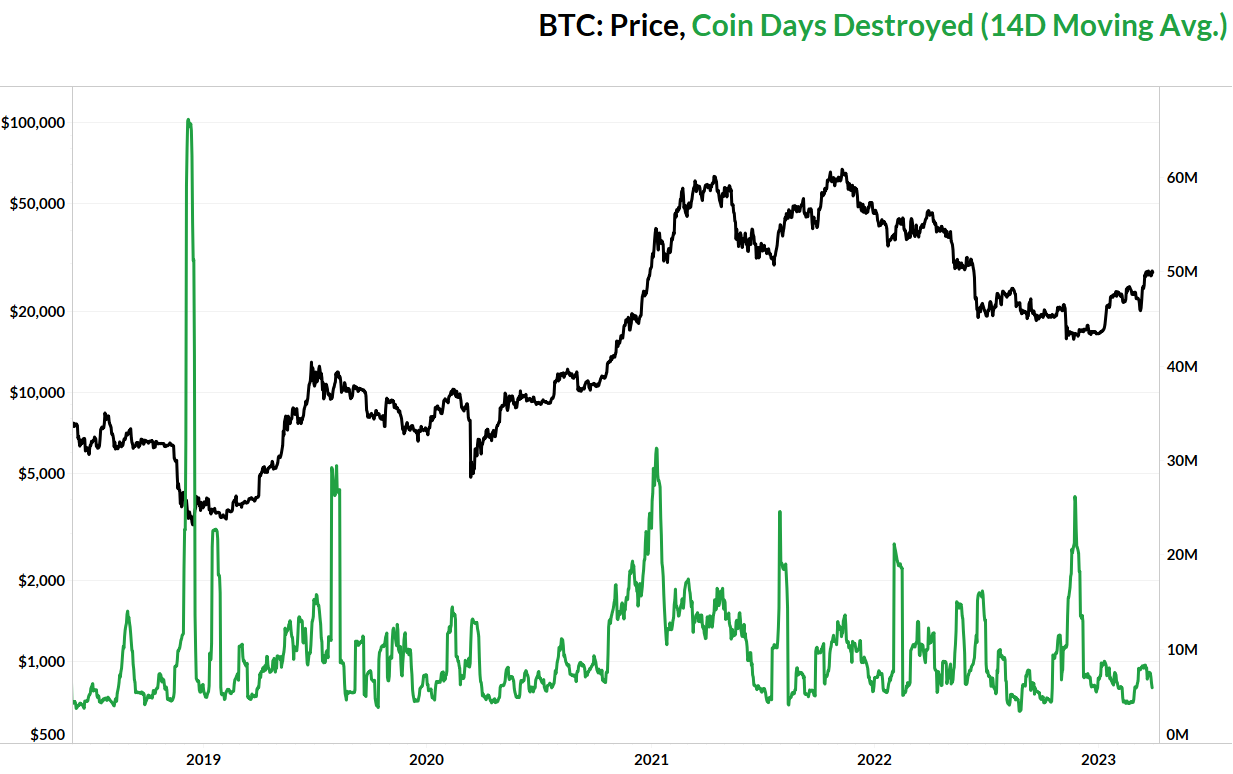
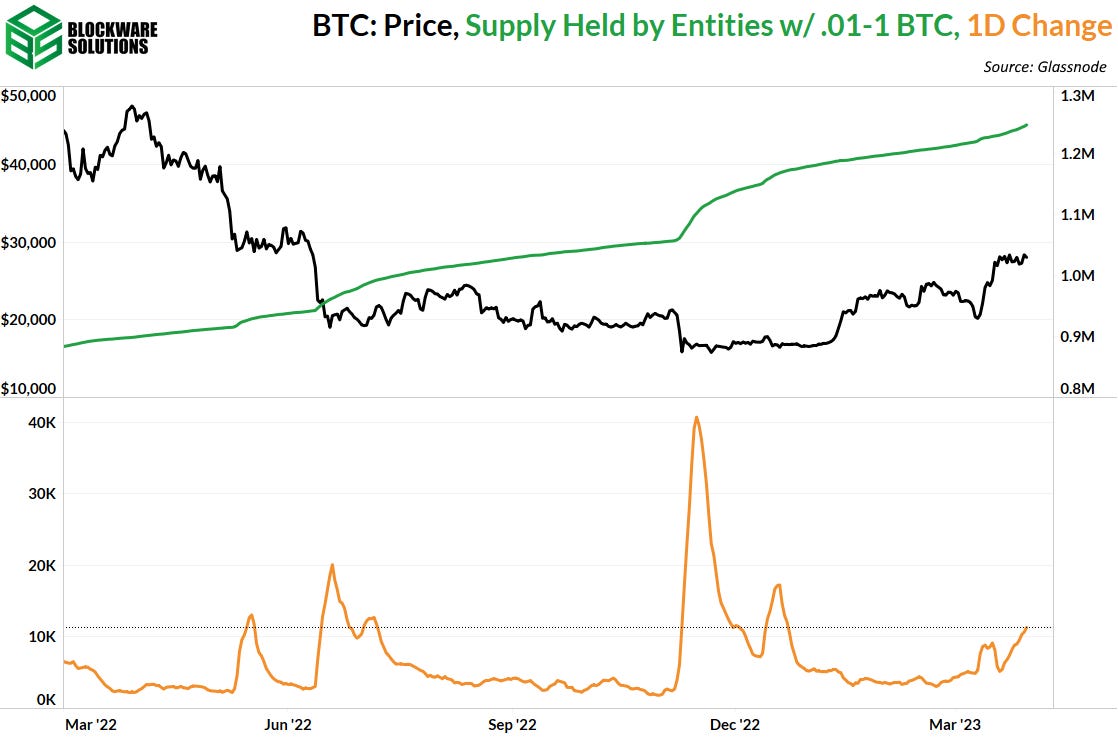
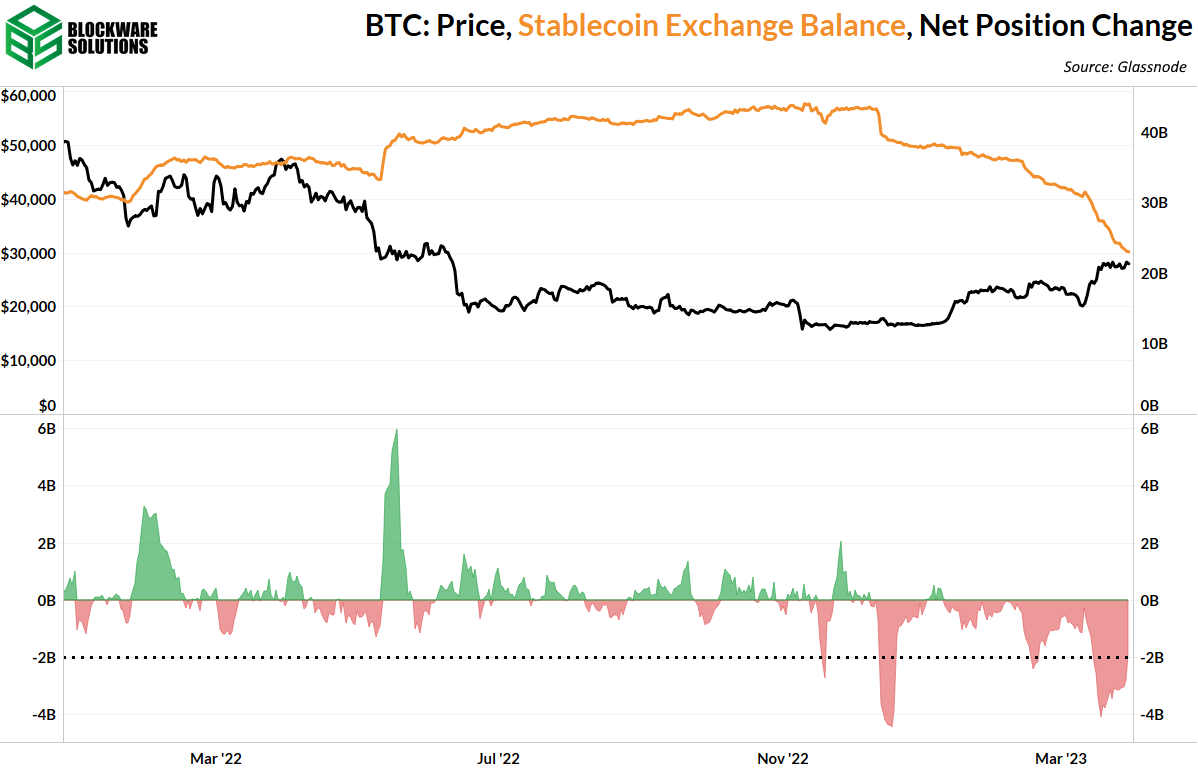
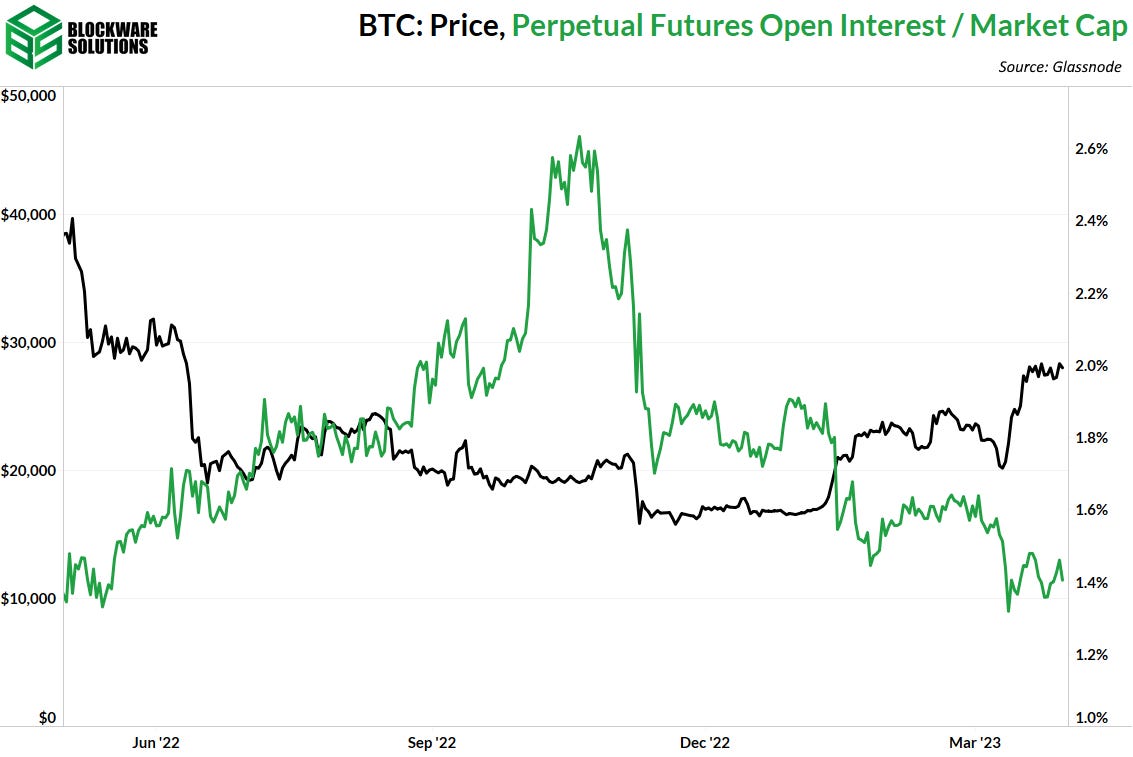
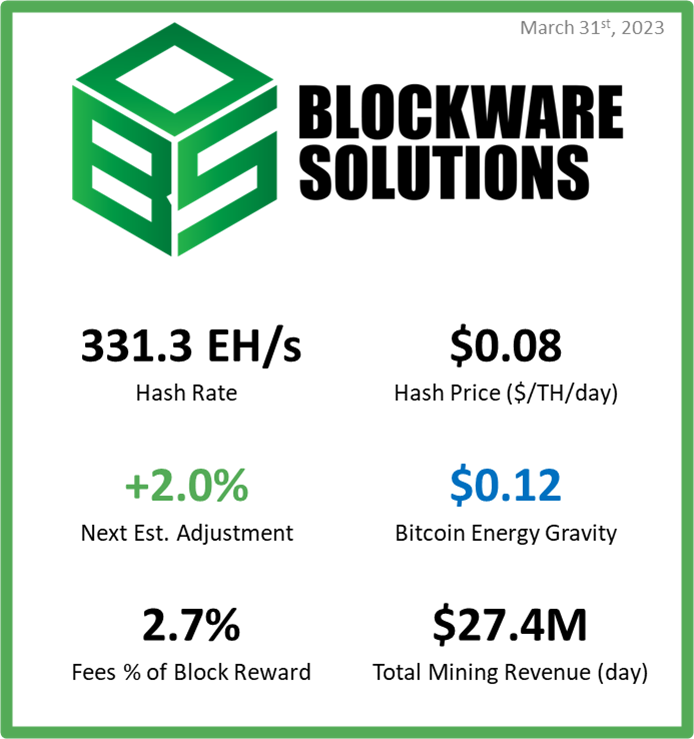
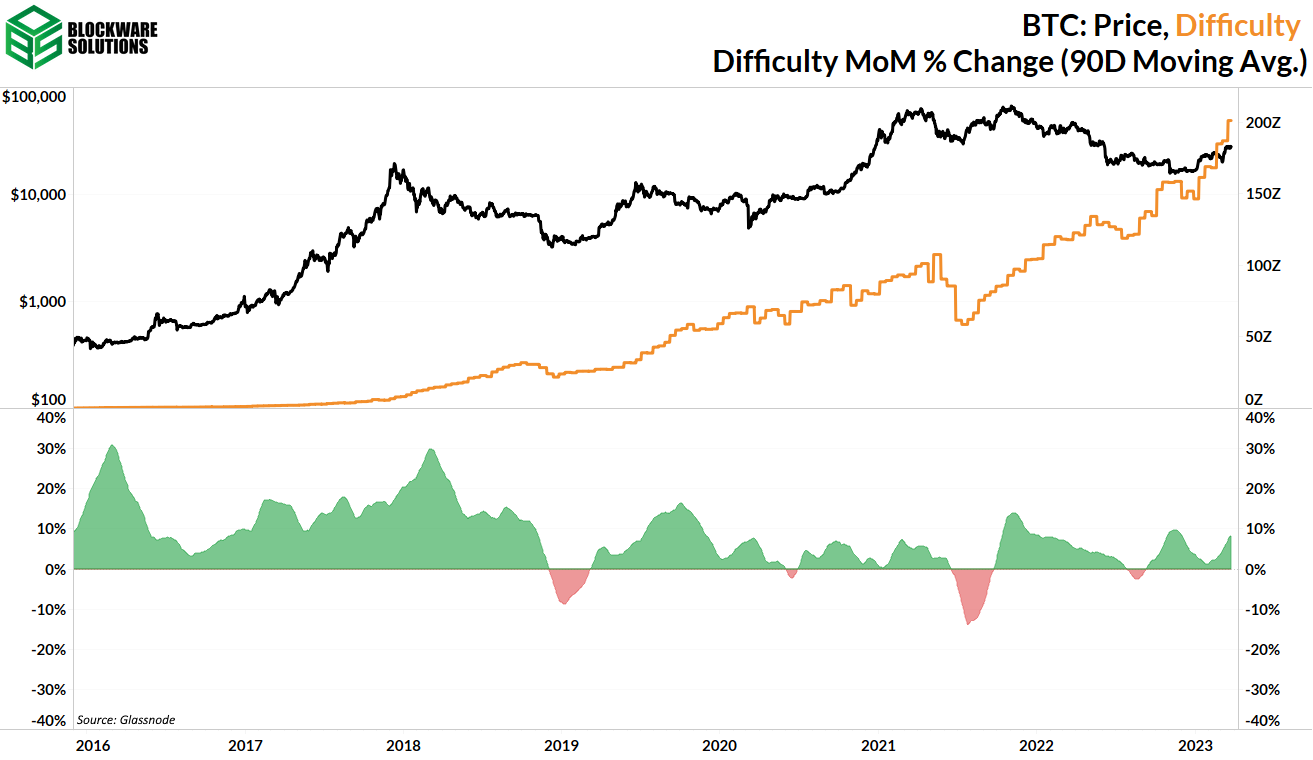
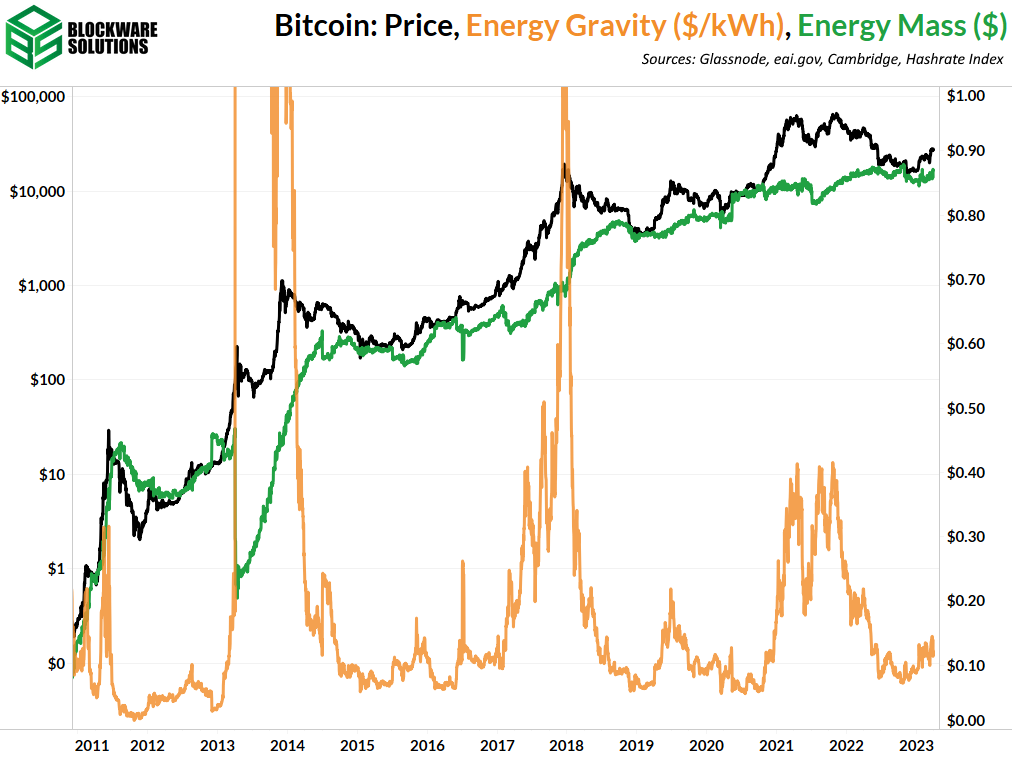
Personally, I subscribe to theory #2, but of course I’m just speculating. Heading into next week, note that the markets will be closed on Friday April 7th in observance of Good Friday. Bitcoin-Exposed Equities Overall, it’s been a strong week for Bitcoin-equities following the uptick in BTC price. It would appear that the market isn’t overly concerned about any contagion surrounding the CFTC investigation of Binance. At the moment, Riot Platforms (RIOT) is the clear leader in this industry group, from a price action standpoint. Behind RIOT, we’ve also seen signs of strength from MSTR, BRPHF, MARA, and CIFR as of late. Above, as always, is the table comparing the Monday-Thursday performance of several Bitcoin-exposed equities. Bitcoin Technical Analysis This week, Bitcoin’s price structure is largely unchanged from what we discussed last week. Bitcoin / US Dollar, 1D (Tradingview) BTC is still range bound, hovering between the 10-day EMA and ~$28,800 (Summer 2021 Lows). As we mentioned last Friday, ~$25,300 is the level that ultimately needs to be held for bulls to remain in control, however, $26,500 is the level I’m watching in the short-term. Alternatively, a break above $28,800 would be exceptionally bullish. For now, we wait… Bitcoin On-chain and Derivatives Short-term holder realized price just had a bullish-cross with long-term holder realized price. Historically, this cross is 3 for 3 at successfully marking the end of bear markets. Notice how LTH RP has a downwards trajectory despite price being higher than LTH RP. Because price is > LTH RP, long-term holders in aggregate cannot lower their cost through buying spot right now. Therefore, this downward trajectory must be caused by short-term holders aging into the long-term holder cohort. Short-term holders aging into long-term holders is bullish as the likelihood that they continue to HODL their coins increases significantly once they cross this threshold. The US government has sold and will continue to sell BTC that was confiscated in connection with the Silk Road. With plans to sell 41,500 BTC over the remaining course of 2023, this equates to ~150 BTC per day (41,500 / 276). Exchange inflows over the past month have been equivalent to ~37,000 BTC per day. It’s reasonable to assume exchange inflows as sell pressure because there’s no valid reason to send BTC to an exchange unless you intend to sell it. Therefore, 150 BTC represents a mere ~0.4% of additional daily sell pressure. This is minuscule and should be absorbed by the DCA’s of long-term Bitcoiners with little to no issue. In fact, 9,800 of this BTC was dumped onto the market already this year, yet BTC is up ~72% YTD. Coin days destroyed measures the number of coins moved on-chain multiplied by the number of days since those coins last moved. This allows us to access the market activity with an increased emphasis on the behavior of old coins (long term holders); which is valuable as better signals can be derived from viewing the behavior of market veterans. The large spikes in CDD represent capitulation (bottoms) or profit taking (tops). Following the capitulation of the 2018 bear market bottom, long-term holders began to slowly take profits as the price increased off the lows. This time around they are behaving differently. Despite the increase in price of the 2022 lows, LTHs are, generally speaking, not interested in taking fiat profits. CDD continues to move sideways which indicates minimal movement from the oldest coins on the network. Entities with .01 to 1 BTC continue to accumulate in droves as well. Despite price being up 72% YTD, these retail-sized entities are accumulating with nearly the same intensity as they were following the massive dips that occurred post-celsius and post-FTX. This is in part what I was referencing when I mentioned the DCA’ers that will have no issue absorbing the BTC being sold by the US Government. To round off the on-chain section, let’s revisit the stablecoin exchange balance metric that we discussed in last week’s newsletter. Stablecoin exchange balances continue to deplete, albeit at a declining pace. However, the decrease is still significant as exchange balances declined by nearly 2 Billion in the past seven days. There’s not much new to discuss on the derivatives side of things. Perpetual futures open interest with respect to market cap has increased slightly this week. However, it remains in a brief period of consolidation within a greater downward trend. Low futures open interest relative to the size of the market indicates that, despite increasing bullish on-chain indicators and price action, traders are generally taking a risk-off approach, likely due to fears of macro-induced contagion. Bitcoin Mining Difficulty has been moving higher As expected from Blockware Intelligence’s 2023 Forecast, mining difficulty in 2023 has continued to increase. While the pace of difficulty growth is higher than most of 2022, the growth rate is still dwarfed by late 2021, 2019, and especially the 2017 bull run. Much of the recent increase in global network hashrate is likely due to old and mid generation machines coming back online as the price of BTC has moved higher, receding high winter energy prices, and new generation models from Bitmain and MicroBT getting deployed. Energy Gravity The following chart is based on a previous Blockware Intelligence Report that models the relationship between Bitcoin’s price and its production cost. The model makes it easy to visualize when the price of Bitcoin is overheated or bottoming.
All content is for informational purposes only. This Blockware Intelligence Newsletter is of general nature and does not consider or address any individual circumstances and is not investment advice, nor should it be construed in any way as tax, accounting, legal, business, financial or regulatory advice. You should seek independent legal and financial advice, including advice as to tax consequences, before making any investment decision. Blockware Intelligence Newsletter is free today. But if you enjoyed this post, you can tell Blockware Intelligence Newsletter that their writing is valuable by pledging a future subscription. You won’t be charged unless they enable payments.
Read Blockware Intelligence Newsletter in the app
Listen to posts, join subscriber chats, and never miss an update from Blockware Intelligence.
© 2023 Blockware Solutions |

