Blockware Intelligence Newsletter: Week 83
Blockware Intelligence Newsletter: Week 83Bitcoin on-chain analysis, mining analysis, macro analysis; overview of 4/8/23-4/14/23
Blockware Intelligence Sponsors
Summary:
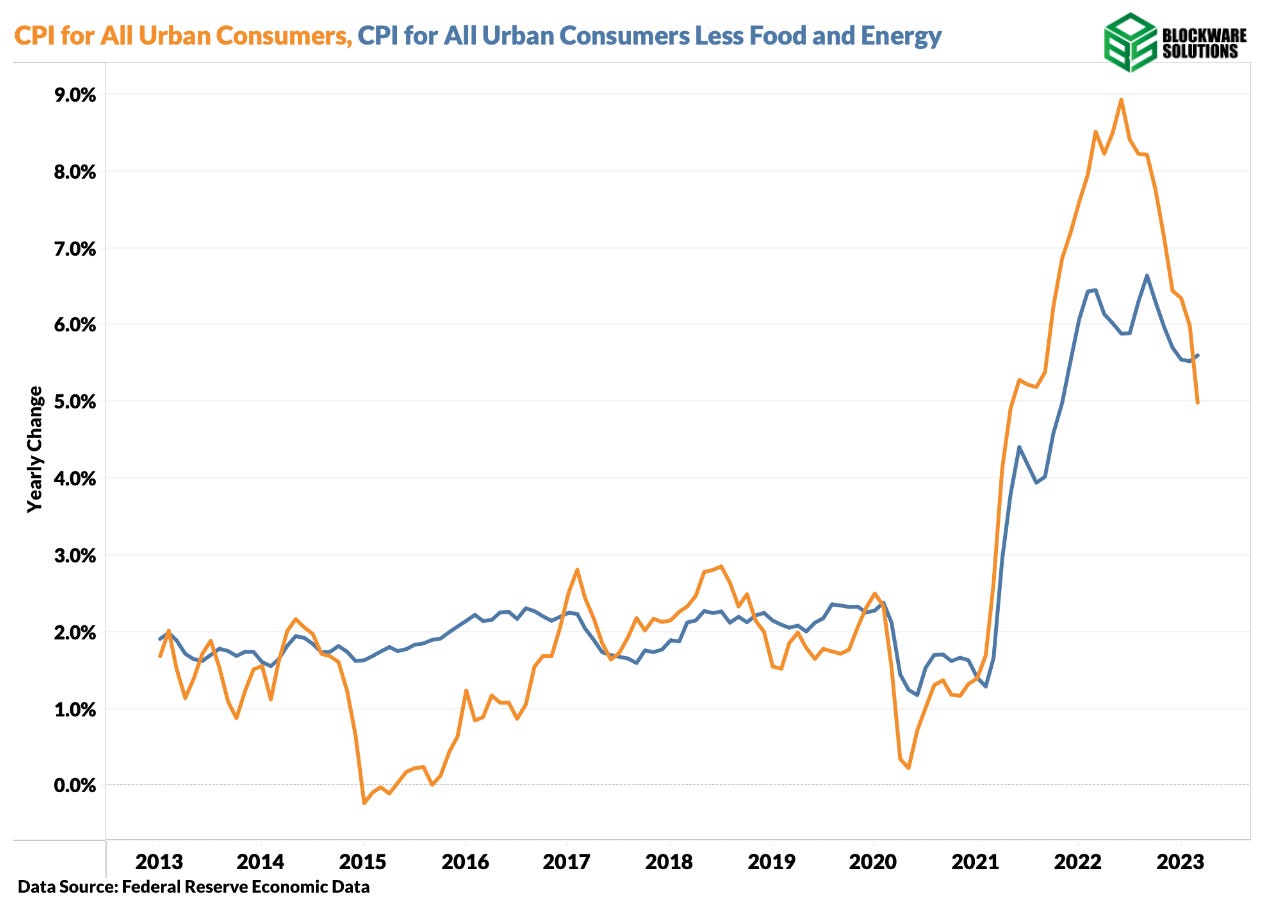
General Market Update Following the release of March CPI on Wednesday, it’s been an interesting week of price action.
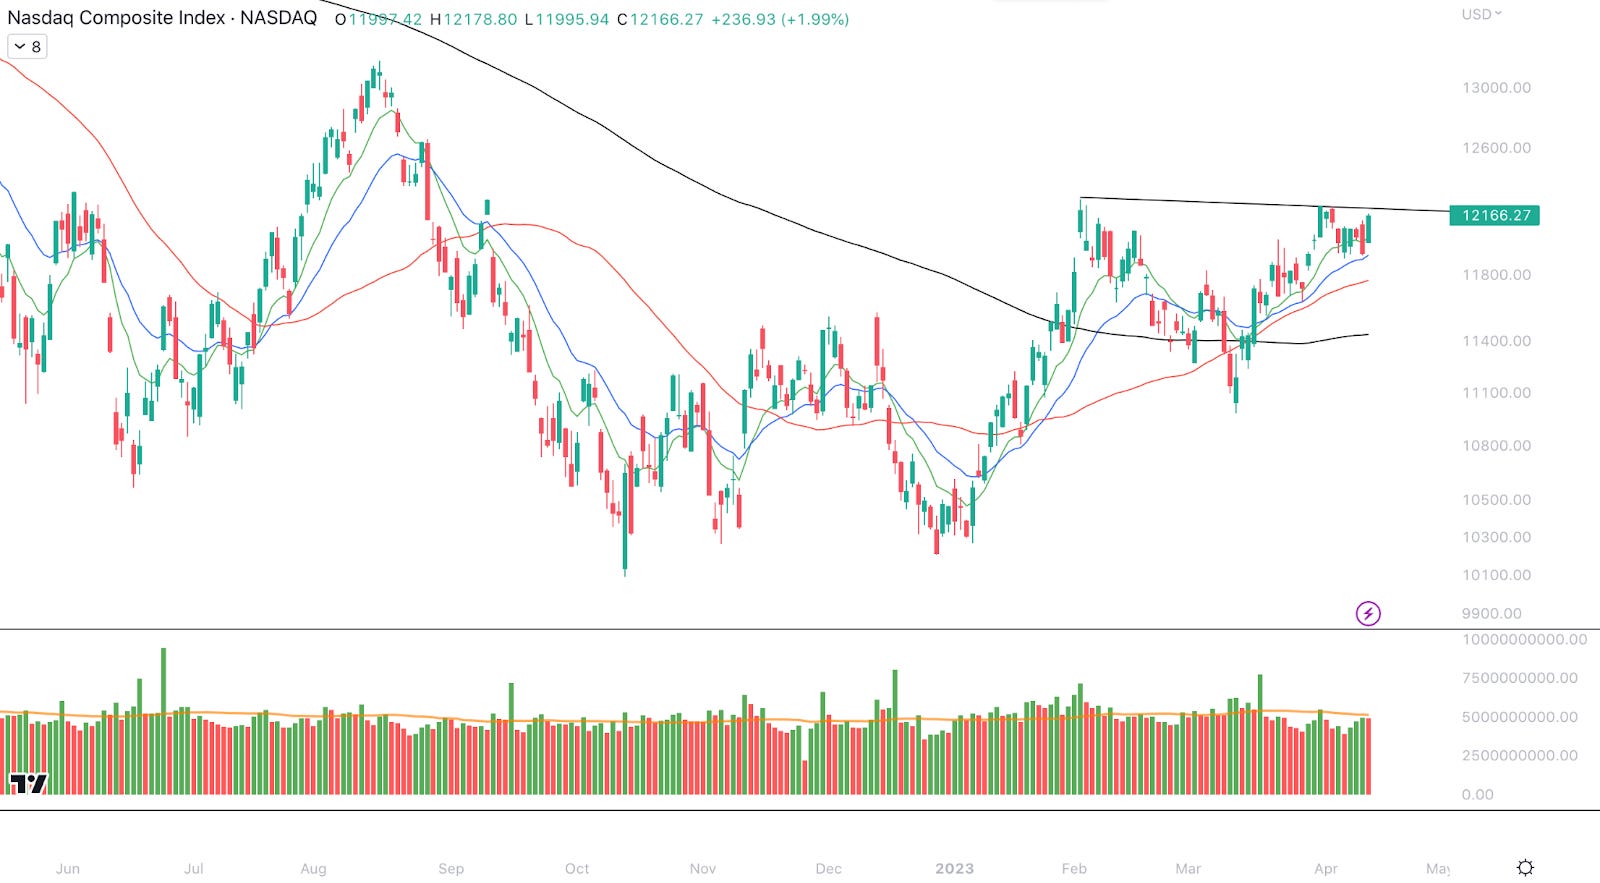
For the month of March, the basket of goods that the Consumer Price Index (CPI) measures grew in price by 5.0% YoY, below market expectations of 5.1%. CPI rose by 0.1% on a MoM basis, also 10bps below expectations of 0.2%. Core CPI (CPI minus food and energy components) rose by 5.6% YoY and 0.4% MoM, both of which were in-line with market expectations. It’s certainly interesting to see core CPI now higher than headline. This tells us that the energy and food components of headline CPI are the main drivers of the current disinflation. At this point in the cycle, it’s hard to argue the once consensus argument that inflation would be sticky. However, it is important to keep in mind that CPI inflation began to ramp up around this time last year. If the pace of growth was higher a year ago than it is today, you’ll see declining YoY numbers. March’s CPI report gave much welcomed confirmation to the Fed that their regime of restrictive monetary policy is beginning to have its intended effect, to dry up demand and lower prices. It’s important to remember that monetary policy has a very lagged effect on real world prices. We’re just beginning to see CPI inflation really turn the corner, after over a year of rate hikes. There is concern, however, that prices eventually could go from disinflationary, to deflationary. Remember that a declining CPI value doesn’t mean that prices are declining. In fact, prices are still rising, just less than before. Prices are a function of demand, so as consumer demand growth has slowed, so has inflation. If you’re one who believes that the US is steering itself into a full-blown recession, then we’d likely begin to see prices in a net decline eventually. Despite Fed analysts now believing that we’ll enter a recession in 2023, the market has had yet another strong week of price action. Nasdaq Composite Index, 1D (Tradingview)
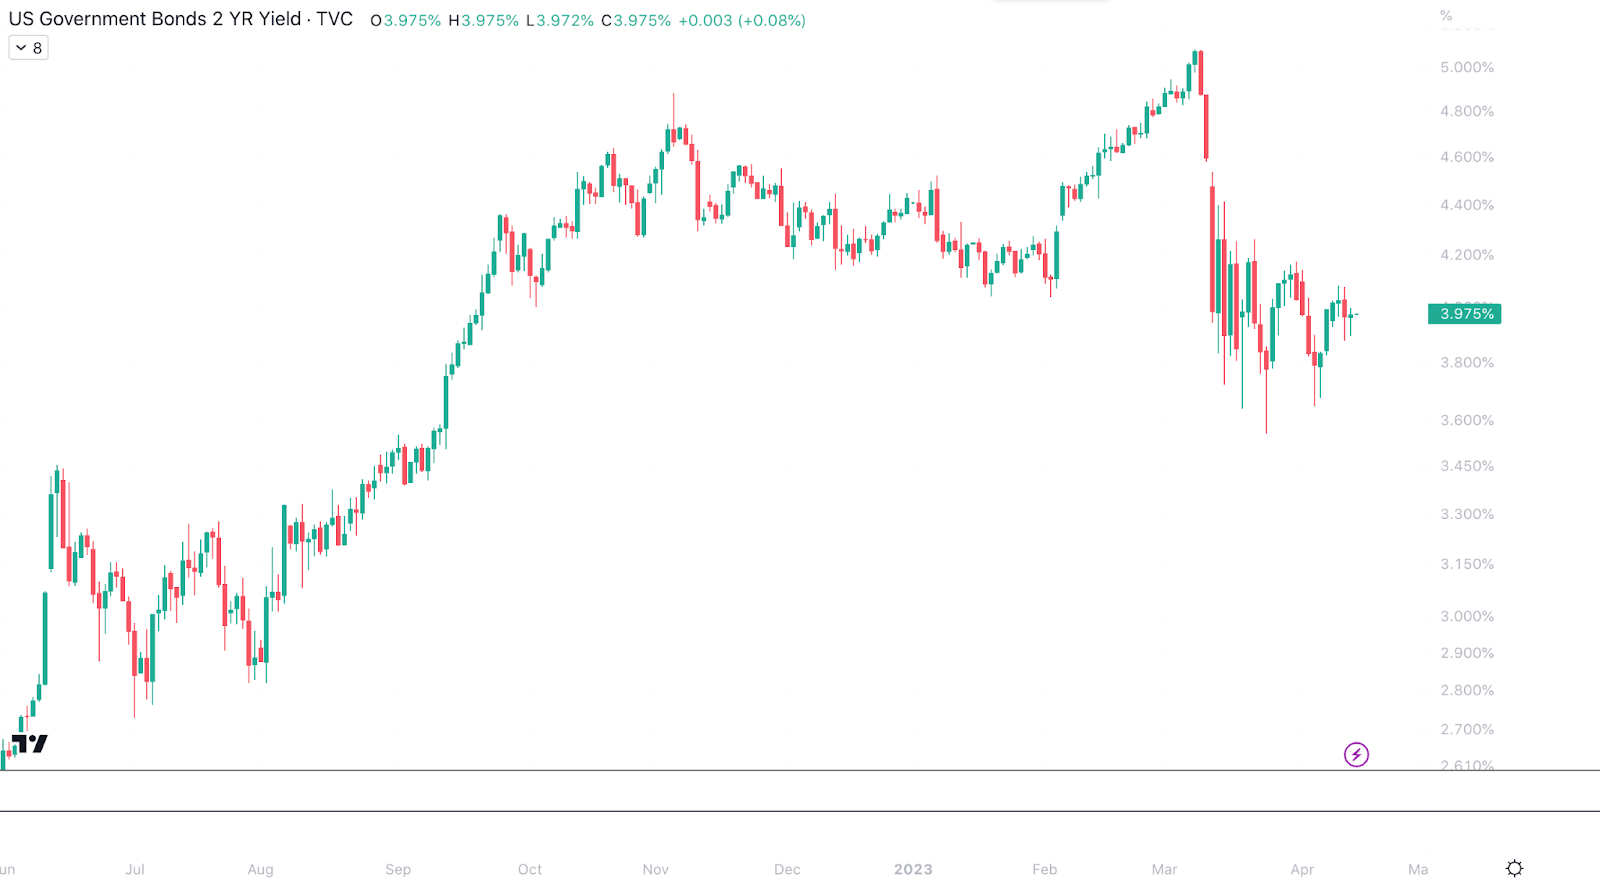
After a short consolidation, the Nasdaq headed back higher on Thursday, closing up nearly 2% on the session. Despite their best efforts on Wednesday, sellers have simply been unable to sustain control in the last few weeks. Breadth is expanding as more names enter the rally. While the market hasn’t received full confirmation, this is typical bull market price action. Look for short-term confirmation with a cross above ~$12,225 for the Nasdaq. US 2-Year Treasury Yield, 1D (Tradingview)
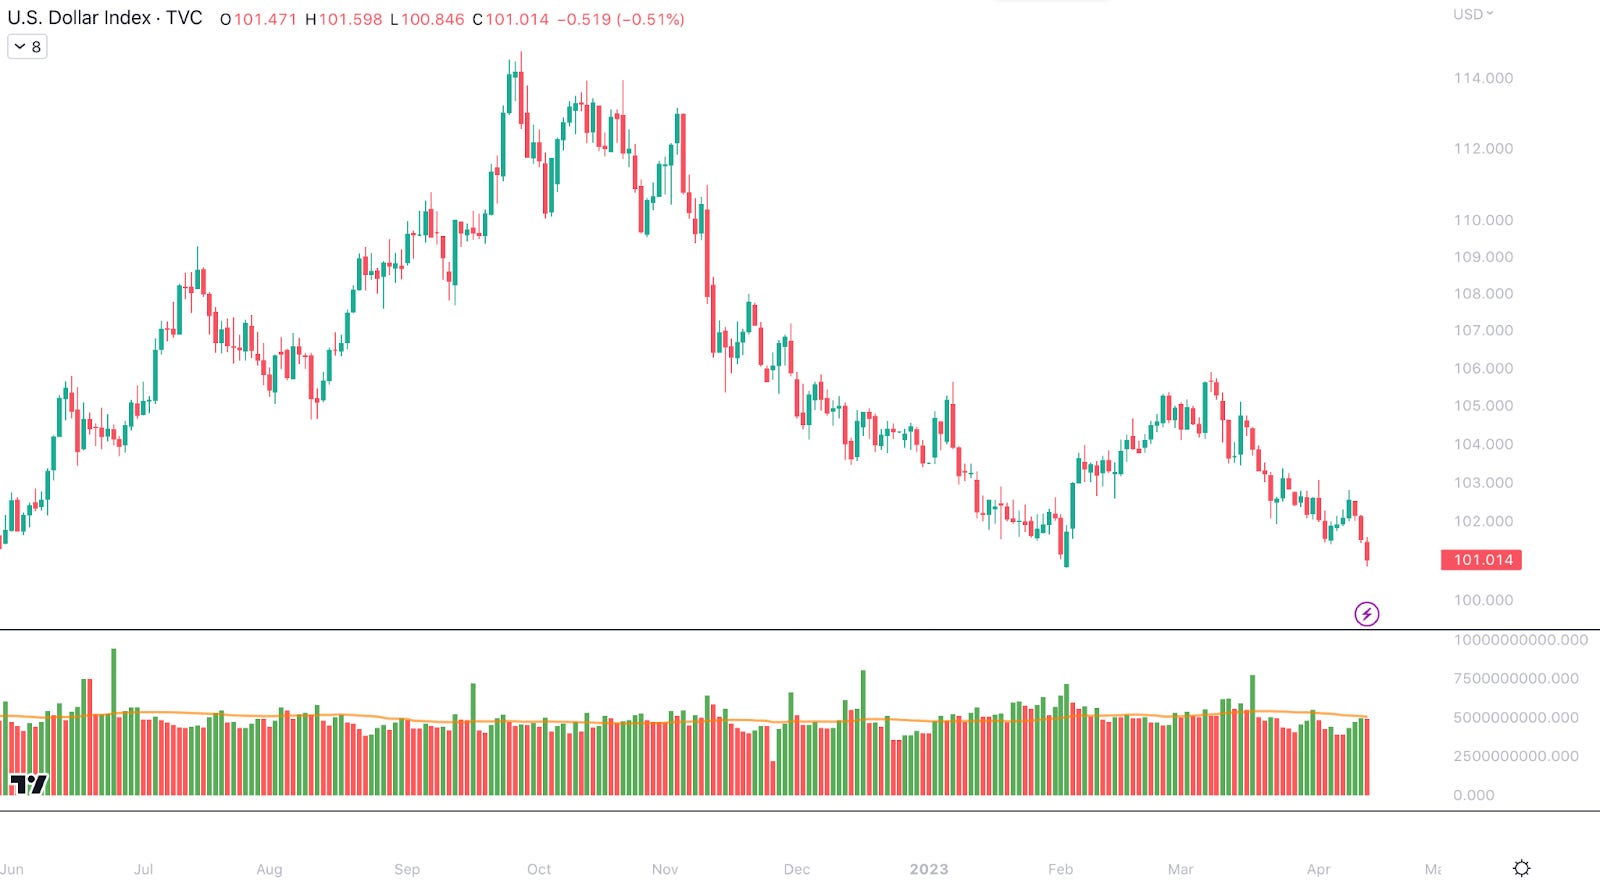
We’ve also seen a somewhat bullish reaction from the Treasury market following the CPI news. Yields fell on both Wednesday and Thursday as the fixed-income market continued to price in lower future rates. This creates tailwinds for risk asset prices, because the discount rate is falling for NPV calculations. Furthermore, lower yields will drive lower demand for the dollar. US Dollar Index, 1D (Tradingview)
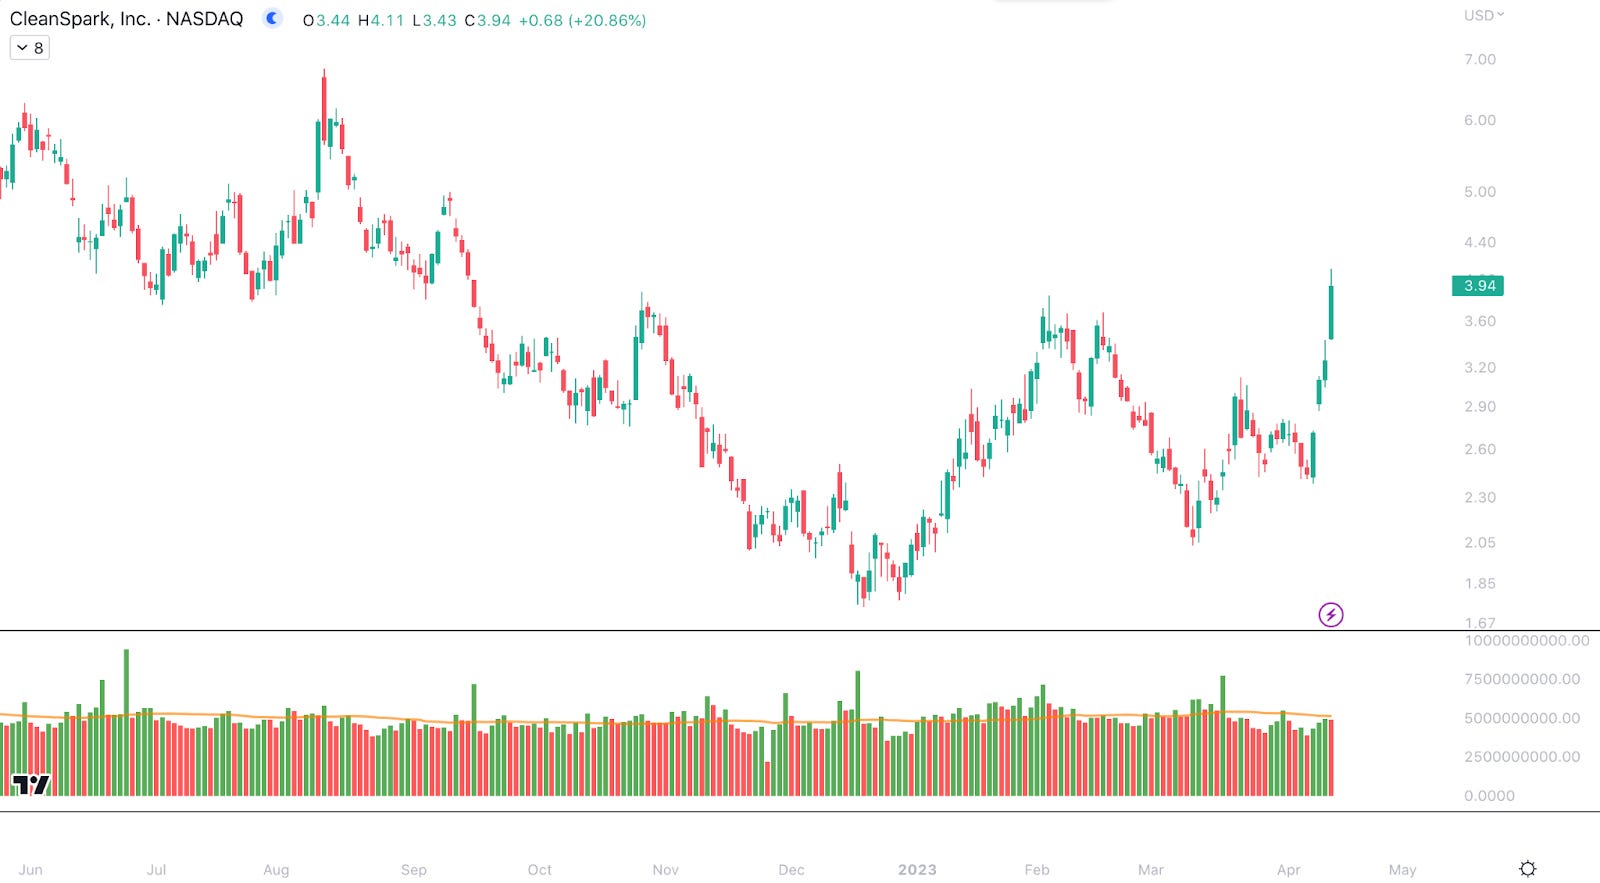
This week has been a poor one for the US dollar, driven by continued strength in the bond market. A weaker value for the US dollar is generally bullish for stocks, as it gives foreign consumers more purchasing power. This relationship usually bleeds into other risk assets, Bitcoin included. Bitcoin Exposed Equities It has been an awesome week of price action among crypto-exposed equities. This comes after several firms announced their March production updates, alongside excellent Bitcoin price action. The most interesting piece of news this week came from Cleanspark, who announced an order of 45,000 S19 XP’s (a $144.9M buy). Once they are energized in September, this will effectively double CLSK’s hashrate. CLSK, 1D (Tradingview)
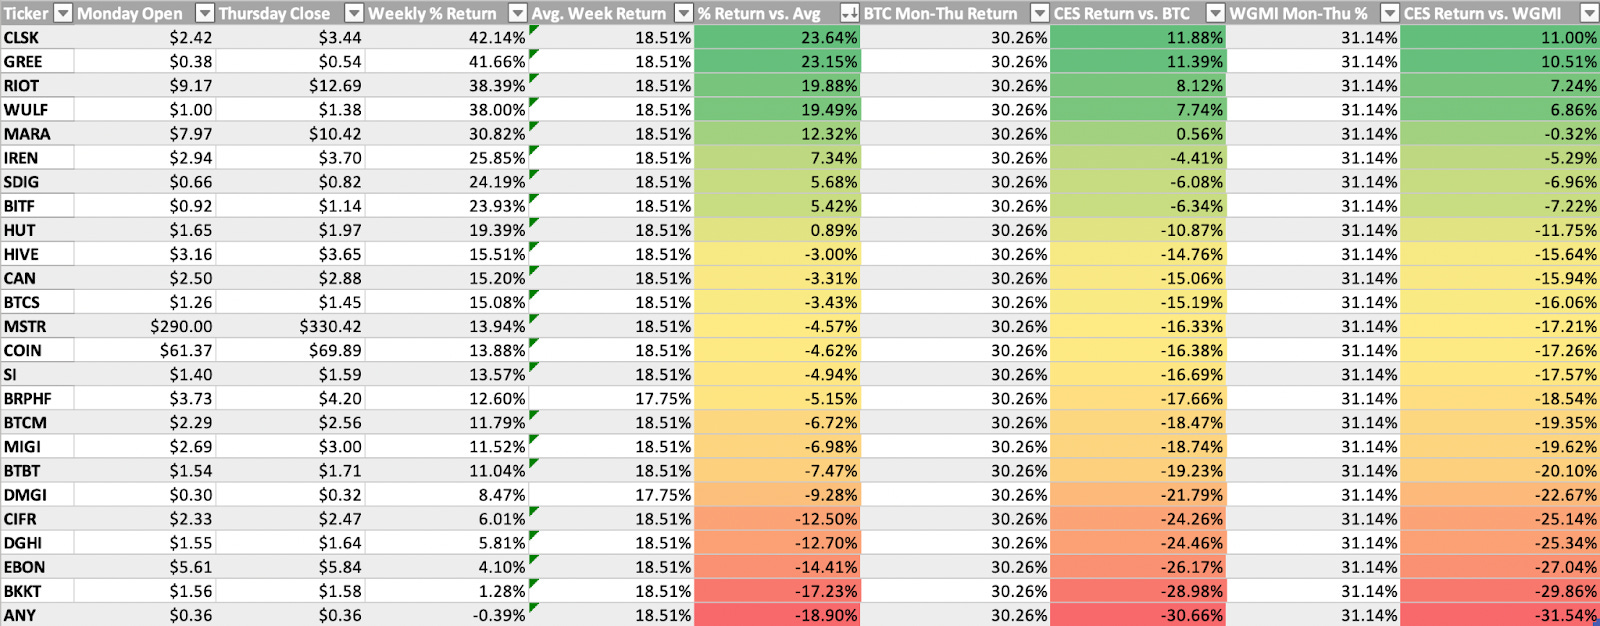
The market clearly liked this news, as CLSK currently sits up over 70% on the week, as of Friday morning. This should make sense, as CLSK has invested in a project to essentially double their revenue making capacity. CLSK has continuously dominated the news cycle of recent, as their relatively conservative business model has allowed them to capitalize on low rig prices and failing competitors. Throughout 2020-21, most miners implemented the “mine and hold” strategy, which entails never telling any of the BTC you mine, aside from making payroll, taxes, etc. Cleanspark instead elected to sell most of the BTC they were mining, allowing them to build a safety net of cash in a bull market. Now as the market has turned, they’re putting that cash to work. Aside from CLSK, we’ve also seen a very strong week from many miners. Some other standouts are HIVE, BITF, MARA, SDIG, BTBT, RIOT, GREE, WULF, and IREN. I haven’t been able to list that many good-looking charts in a very long time, so that should say a lot about this market.
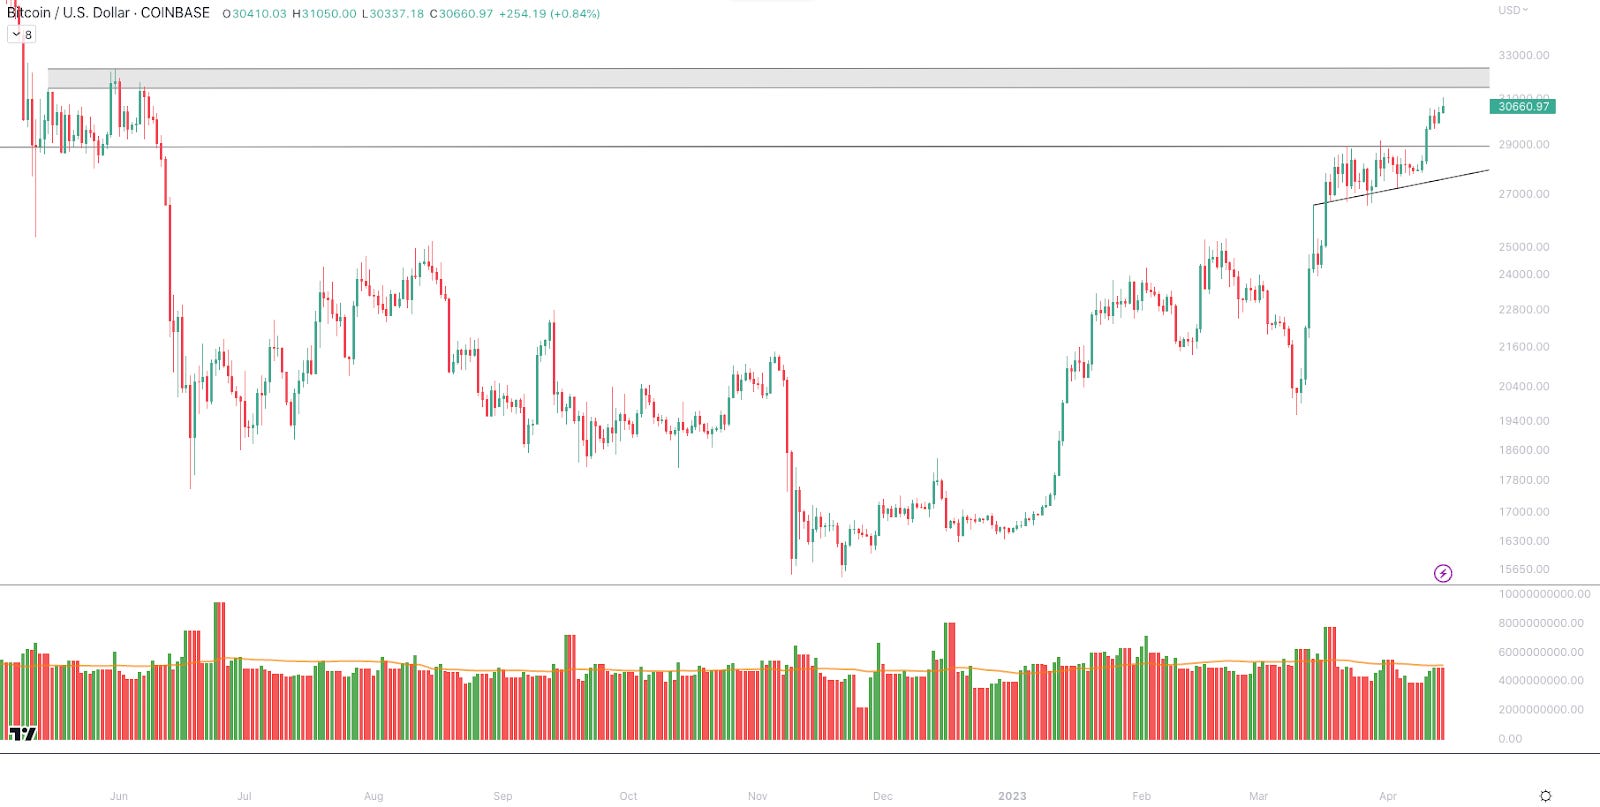
The chart above compares the Monday-Thursday performance of several miners. Bitcoin Technical Analysis As previously mentioned, this week has also been a strong one for Bitcoin price (in case you hadn’t noticed). Bitcoin / US Dollar, 1D (Tradingview)
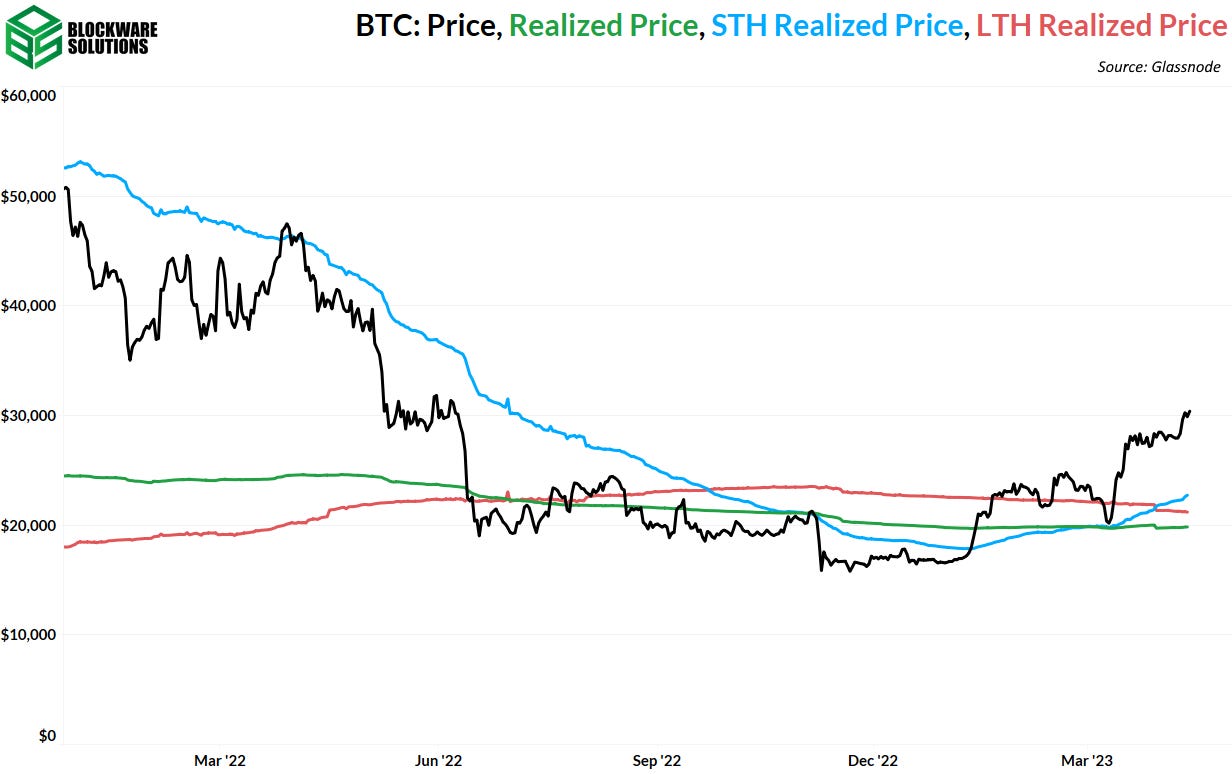
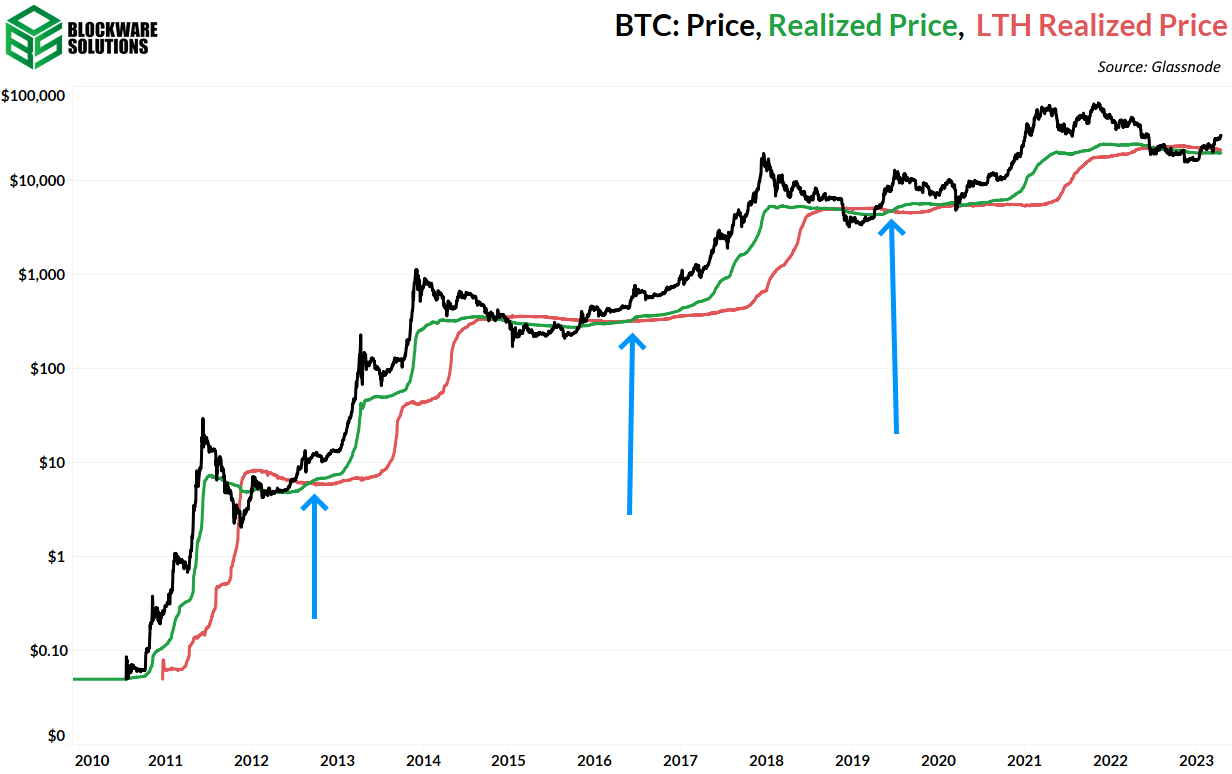
Monday was the big day, as BTC cleared up through its long-held range and began to rip higher. That being said, this buying hasn’t been on very strong volume. BTC tapped $31,050 Friday morning, but as of the time of writing, sellers have regained some control. The next major resistance level we see for BTC lies between $31,500 and $32,500. Ideally, if BTC is able to reach this level, we would see another consolidation similar to the one we just emerged from. If BTC isn’t able to break through this level, we would like to see buyers step back in at the top of this previous range, at ~$29,000. Fingers crossed for a strong weekend. Bitcoin On-chain and Derivatives Bitcoin surpassed $30,000 for the first time in 10 months. While this is certainly a significant milestone from a psychological perspective, this does not change our fundamental outlook from an on-chain perspective as Bitcoin has already crossed key on-chain realized price levels, indicating the worst of the bear market is likely behind us.
The last major milestone in regards to the cost-basis metrics will be when realized price crosses back above long-term holder realized price. This has accurately signaled the end of the past three bear markets.
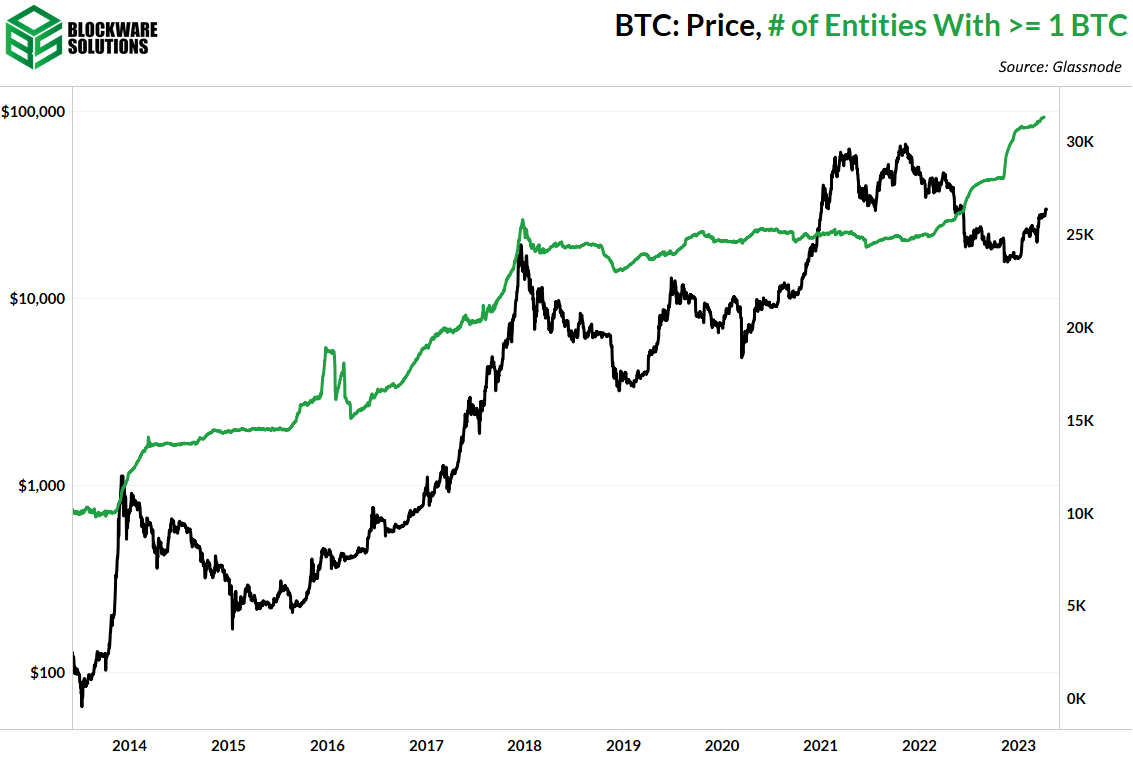
~31,188 unique on-chain entities hold 1 or more BTC. Unlike past bear markets, this metric has increased despite the fact that it is much more difficult to acquire 1 whole BTC than in previous bear markets. This is a strong signal that humanity is becoming increasingly convinced that, despite its unnerving volatility, Bitcoin is here to stay and is a superior form of property.
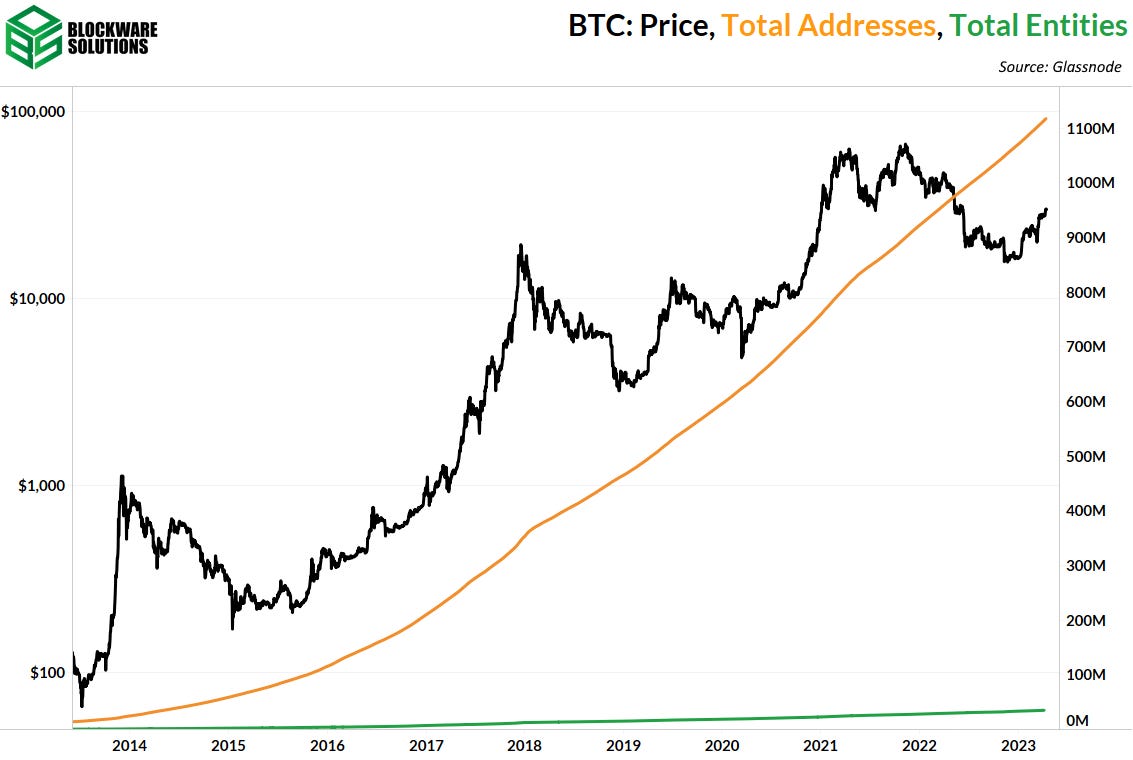
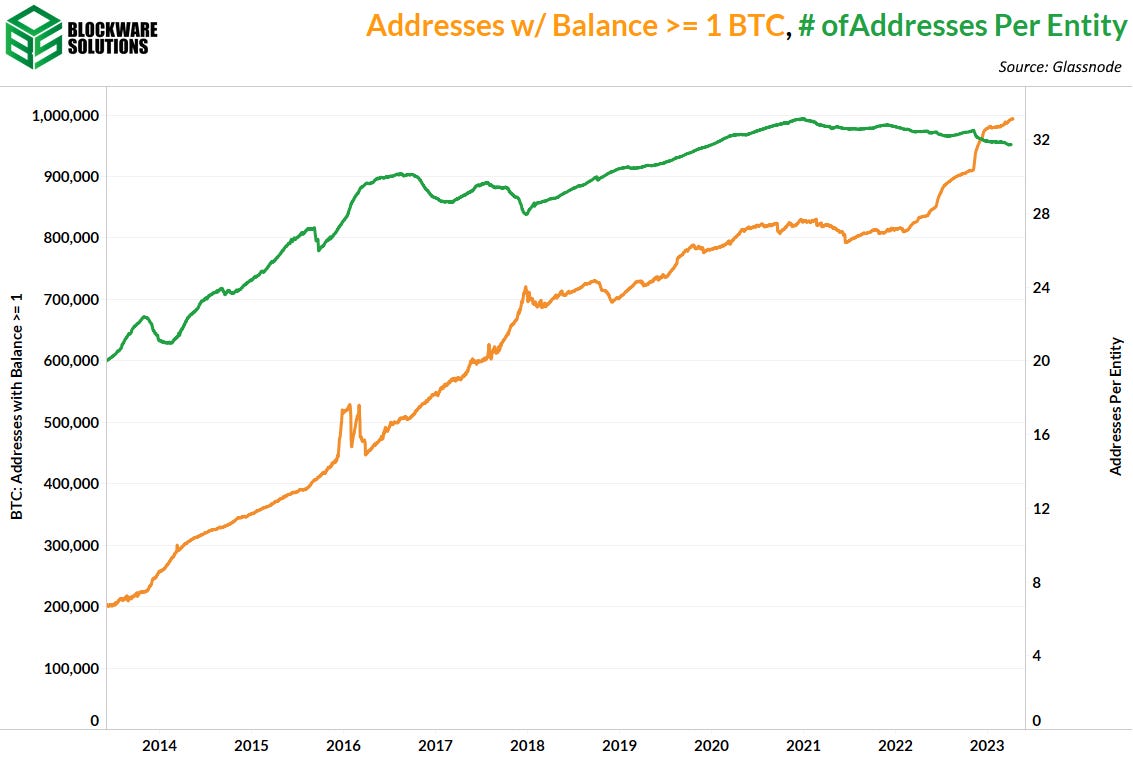
~31,188 ‘wholecoiners’ may seem low to some of you so allow me to explain how this number was calculated. Firstly, this was calculated using Glassnode’s ‘entity-adjusted metrics’; which you can read more about here. Glassnode delineated between ‘addresses’ and ‘entities.’ Because, in case you are new to Bitcoin, a single user/wallet/entity/private key can have access to an infinite number of public addresses. In fact, it is common practice (and the default setting on most wallets) to generate a unique public address every time you receive BTC. As such, someone that dollar cost averages daily is going to get a new address every day. Glassnode’s entity adjusted metrics attempt to account for such behavior and provide an accurate estimate of unique on-chain entities. Secondly, as with all on-chain metrics, individual holdings that are kept on an exchange are not accounted for. Addresses that are confirmed to belong to an exchange are all aggregated and count as a single entity for each exchange. Moreover, someone that keeps BTC on an exchange does not actually own BTC, therefore it would be inaccurate to include them in such calculations. Now that these parameters have been established, we can begin dissecting the data. Note the vast difference between the number of addresses and number of entities. Dividing the former by the latter means that, on average, each entity controls ~32 addresses.
Next, we’ll divide the number of addresses that hold 1 or more BTC by the 32 addresses per entity. This division gives us an estimate of the number of entities that hold 1 or more BTC.
Conceptually, there’s two more ideas to think about.
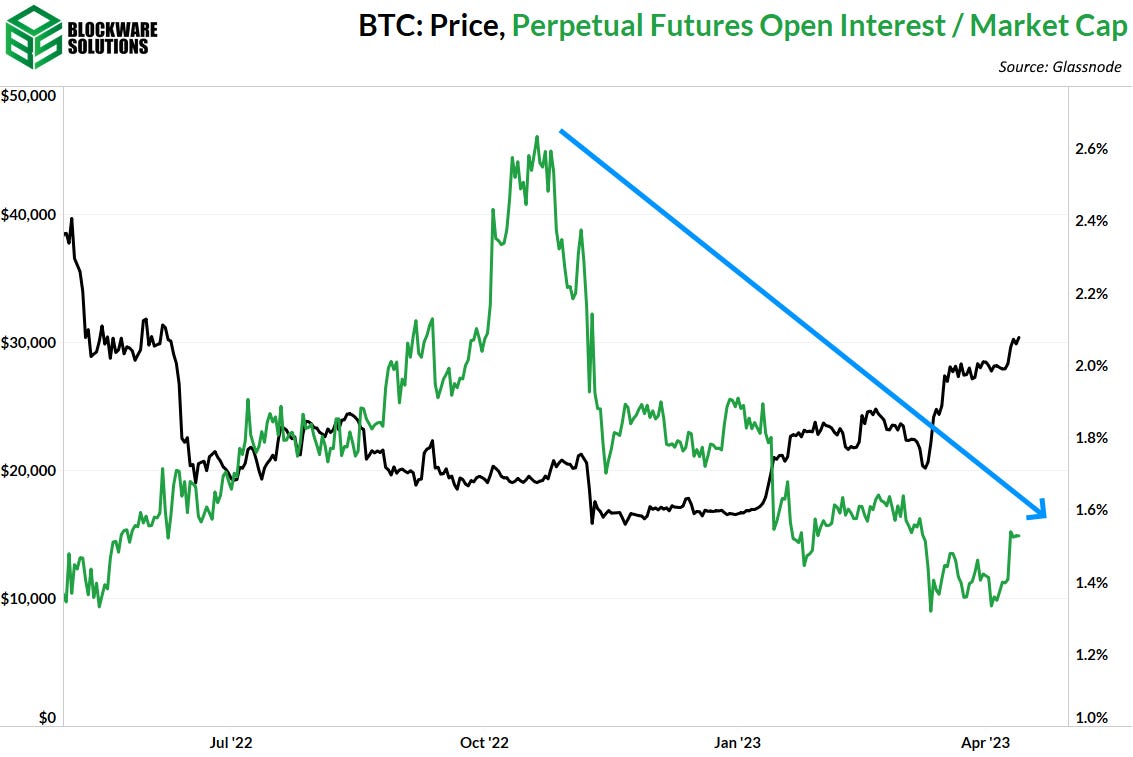
Considering both of these factors, it would be more reasonable to assume that 31,188 unique ‘wholecoiners’ is actually a HIGH BALL estimate. If my Bitcoin thesis is correct, the 31,188 entities will have an unfathomable amount of capital and influence for such a small group of people. However, it will pale in comparison to the influence of the 12 individuals comprising the FOMC that currently dictate the monetary policy of the most widely used currency. Moreover, no amount of BTC holdings gives anybody control of the network due to the proof-of-work consensus mechanism and the ability of nodes to self-enforce the ruleset. —- Now, let’s dissect this week’s rally from the derivatives side of things. In the wake of this rally the market has taken on slightly more risk. Open interest relative to market cap has spiked, however, the downtrend is still intact and it is too early to say that risk is re-entering the market in any meaningful way.
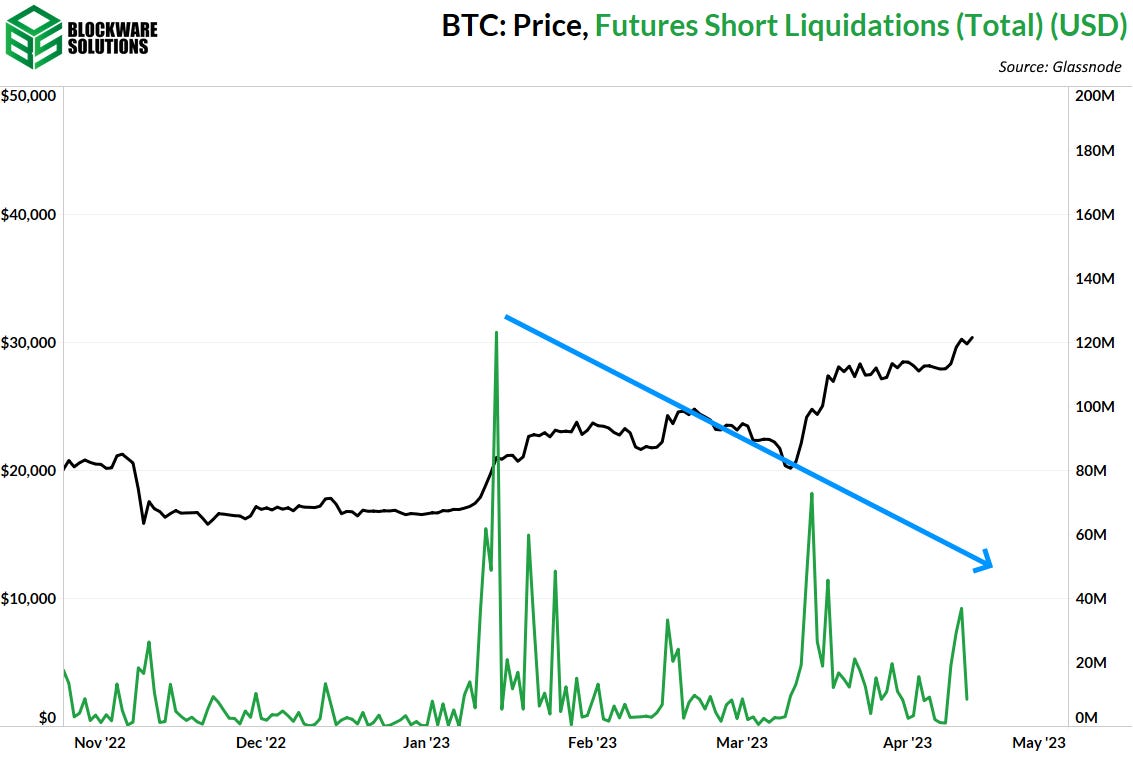
There was $37 million worth of short liquidations on the pump to $30,000 at the beginning of the week. The trend of de-leveraging is evident by the diminishing total amount of short liquidations with each of the significant price pumps this year.
Bitcoin Mining
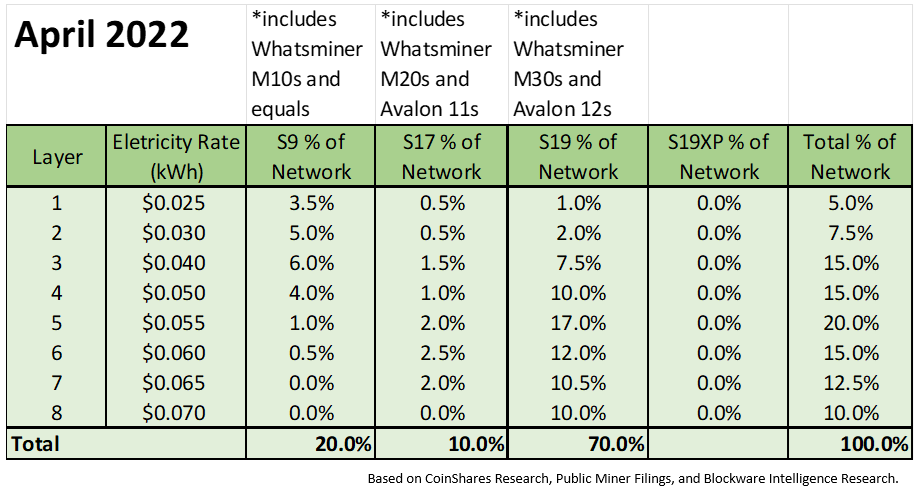
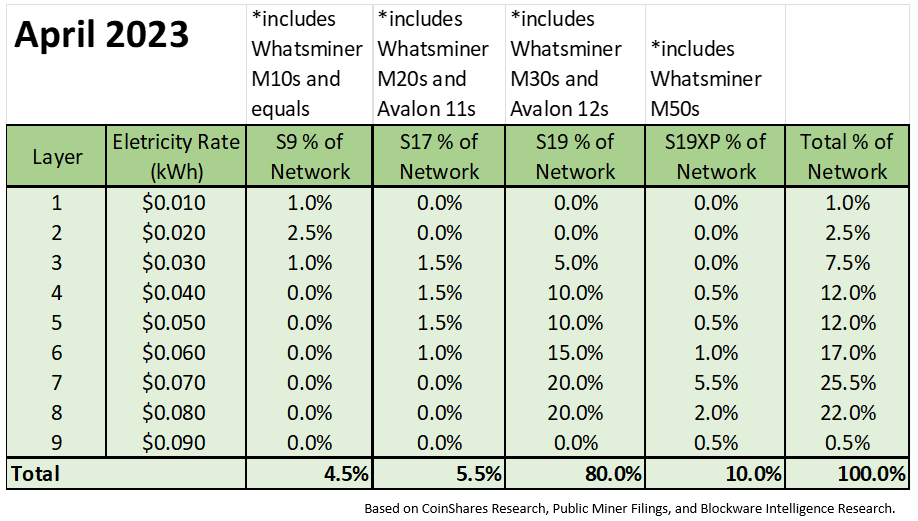
Network Efficiency Distribution Breakdown Before estimating April 2023’s miner breakdown, we need a previous estimation to establish a base. Below is the estimated breakdown in April 2022 from a previous Blockware Intelligence Report using public miner investor relations resources, Coinshares Research, and Blockware Research.
With a total network hashrate of 200 EH/s in April 2022 and the above percentage breakdown by ASIC efficiency category, each category contained the following nominal amount of hashrate. S9 (and equal competitor models) = 40 EH/s S17 (and equal competitor models) = 20 EH/s S19 (and equal competitor models) = 140 EH/s From there, the following assumptions enable us to rebuild the miner distribution table for April 2023 as the total network hashrate is now at 340 EH/s. Assumptions and Estimations:
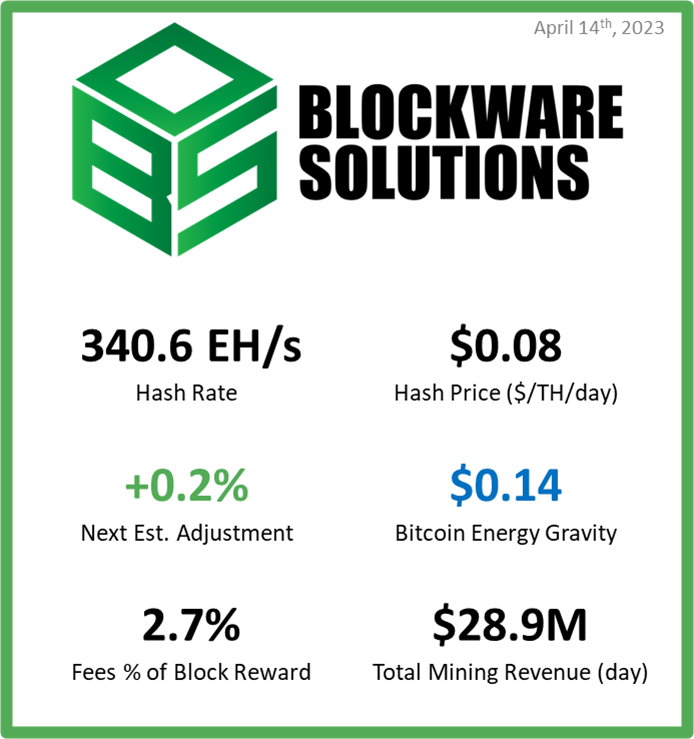
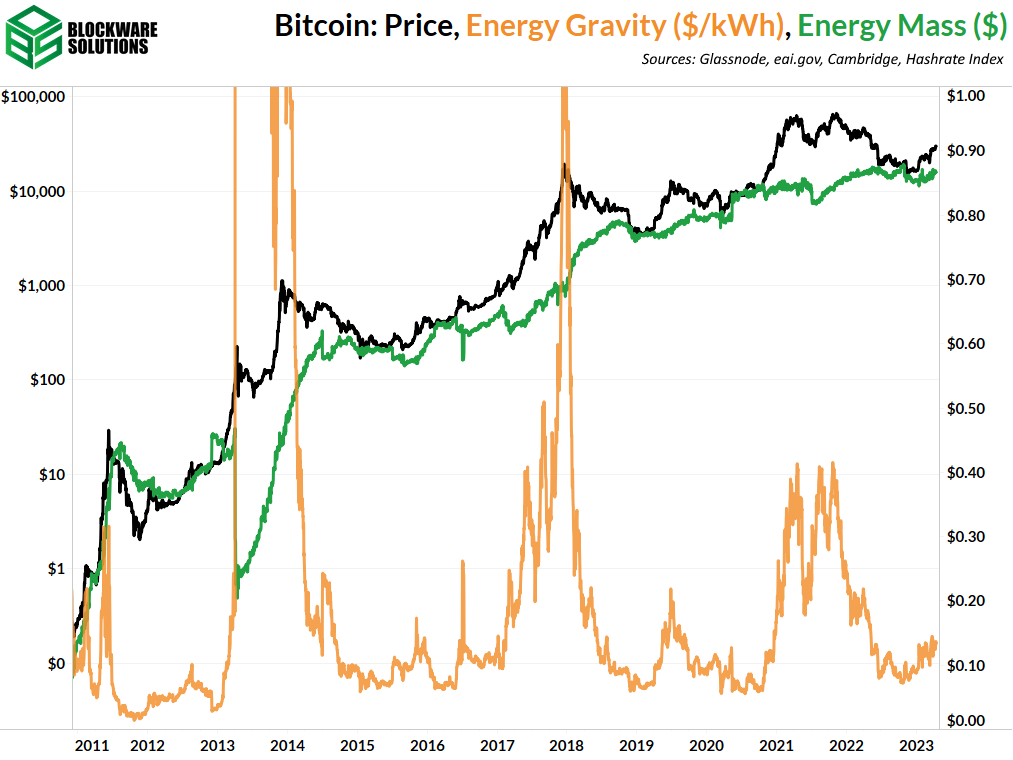
S9 (and equal competitor models) = 15.25 EH/s (- 62%) S17 (and equal competitor models) = 19 EH/s (- 5%) S19 (and equal competitor models) = 272 EH/s (+ 94%) S19XP (and equal competitor models) = 34 EH/s Estimated Weighted Average Efficiency = ~ 32.2 W/TH Energy Gravity The following chart is based on a previous Blockware Intelligence Report that models the relationship between Bitcoin’s price and its production cost. The model makes it easy to visualize when the price of Bitcoin is overheated or bottoming.
All content is for informational purposes only. This Blockware Intelligence Newsletter is of general nature and does consider or address any individual circumstances and is not investment advice, nor should it be construed in any way as tax, accounting, legal, business, financial or regulatory advice. You should seek independent legal and financial advice, including advice as to tax consequences, before making any investment decision. Blockware Intelligence Newsletter is free today. But if you enjoyed this post, you can tell Blockware Intelligence Newsletter that their writing is valuable by pledging a future subscription. You won’t be charged unless they enable payments.
Read Blockware Intelligence Newsletter in the app
Listen to posts, join subscriber chats, and never miss an update from Blockware Intelligence.
|